
Investment managers and analysts examine industry performance in relation to other industries (cross-sectional analysis) and over time (time-series analysis).
The objective of industry analysis is to identify industries that offer the highest potential risk-adjusted returns, i.e., industries that generate high return on invested capital relative to the weighted average cost of capital. In this context, it is important to recognize that not all industries perform well at any point in an economic cycle. Economic fundamentals and, hence, economic profits can vary substantially across industries.
Strategic analysis
refers to the process of researching a company’s competitive environment to formulate a corporate strategy.
A commonly used framework for strategic analysis is Michael Porter’s ‘five forces’ framework; shown below:
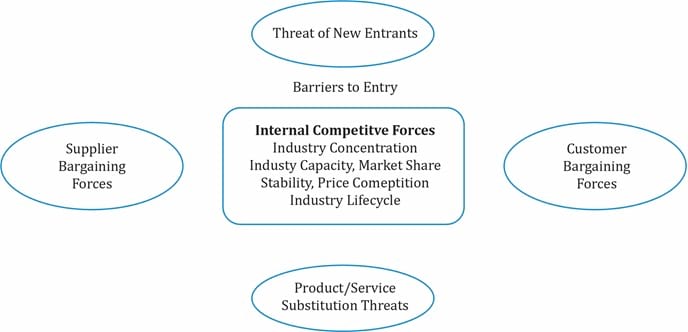
The table below summarizes what each of these five forces means:
| Porter’s Five Forces | |
| Force | Description |
| Threat of substitute products | If substitutes to a company’s products are easily available, then the threat is high and demand for the company’s products will decrease. Customers may switch to alternative products if switching costs are low.
Ex: Low-priced brands are close substitutes to premium brands; low-cost mobiles from China are substitutes to Samsung or iPhone; If coffee prices increase substantially, coffee drinkers may switch to tea; or during a recession, movie goers may prefer to watch movies at home, using substitute forms instead of going to the cinema. If this force is strong, it will weaken the pricing power of the market players. |
| Bargaining power of customers | Customers enjoy bargaining power in industries with large volumes and smaller number of buyers. The price competition and profitability is low as customers demand low prices.
Ex: Airlines ordering numerous aircrafts from Boeing or Airbus. Since airlines typically order a large number of aircrafts, they have high bargaining power. |
| Bargaining power of suppliers | Suppliers enjoy pricing power in industries where suppliers are small and the supply of key inputs to a company is scarce.
Ex: Consumer products companies have limited control over price. |
| Threat of new entrants | If barriers to entry are high, then the threat of new entrants is low. Conversely, if barriers to entry are low, then the threat of new entrants is high.
Ex: The threat of new entrants is high in the mobile handset market. |
| Intensity of rivalry among existing competitors | Industries with high fixed costs, high exit barriers, little differentiation in products, and similar size experience intense rivalry.
Ex: Boeing and Airbus. |
Barriers to entry refers to the ease with which new competitors can entry the industry and challenge existing players.
Do not confuse barriers to entry with barriers to success. Entering some industries may be easy but becoming successful enough to threaten existing players may be quite difficult.
Also, high barriers to entry does not automatically lead to good pricing power. For example, auto manufacturing, commercial aircraft manufacturing, and oil refining industries have significant barriers to entry. But these industries are still very competitive with limited pricing power.
While industry fragmentation is a good indicator of a competitive industry with limited pricing power, there are a few fragmented industries with strong pricing power (the bottom left quadrant in the table below). The following table shows the role of concentration in pricing and competition.
| Two Factor Analysis of Industries: Concentration & Pricing Power | ||
| Strong Pricing Power | Weak Pricing Power | |
| Concentrated | Relatively low capital requirements.
Differentiated products. Less number of players. Less price competition Ex: Soft drinks (Coke, Pepsi). US Defense. US Railroads. Alcoholic beverage industry.
|
Generally capital intensive and sell commodity like products.
Fierce competition between them. Relative market share matters more than absolute market share. Little or no differentiation in products. Ex: Commercial aircraft (Boeing, Airbus). Integrated oil companies (Exxon, Mobil, BP). |
| Fragmented | If one or two players are larger than the others, they compete with small players and not among themselves.
Highly price-competitive. Each player has a smaller absolute market share. Ex: Asset Management Companies (Fidelity). If the customers are not price sensitive, then the players have high pricing power. Home Improvement (Home Depot– 11% and Lowe’s – 7% market share). |
Ex: Consumer packaged goods (Procter & Gamble, Unilever)
Airlines. Retail. Homebuilding. Restaurants. |
When evaluating the impact of industry capacity on pricing, the following points should be considered:
If price is a major factor in customer buying decisions, then competition will be high. Ex: commercial aircraft industry. Price is a major factor in an airline’s purchase decision. This weakens pricing power for Boeing and Airbus.
There are five stages in the life cycle of any industry: embryonic, growth, shakeout, mature, and decline. The characteristics of each stage are depicted in the diagram below:
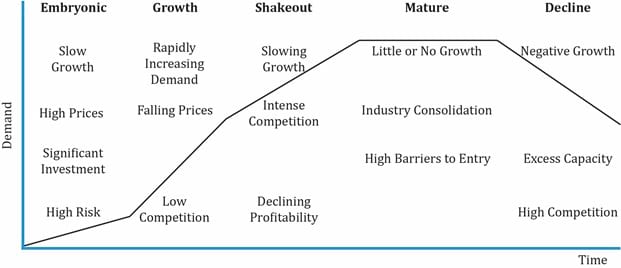
Embryonic
Growth
Shakeout
Mature
Decline
The life-cycle model is a well-defined framework to understand any industry’s evolution. But it is not a cookie-cutter model that all industries adhere to. There are external factors which significantly affect how an industry evolves causing some stages to be shorter or longer than expected. These are technological, social, regulatory, and demographic changes which we will see in detail in the next section.
Limitations of the Industry Life-Cycle Model


Ace the Exam with IFT Notes!

Ace the Exam with Active Learning!
 Do IFT Mocks to make you exam-ready!

Practice your way to success!

Accelerate your studies!


Sign up to get more!