
Instructor’s Note: A summary of the six types of emotional biases is presented below. They are covered in detail in the subsequent sections. Memorize this summary. Use the acronym ‘LOSSER’ to remember this list.
Loss-aversion bias is a bias in which people prefer avoiding losses over achieving gains. When comparing absolute values, the utility derived from a gain is much lower than the utility given up with an equivalent loss. Stated simply, people hurt more when there is a loss and are less happy when they gain the same value.
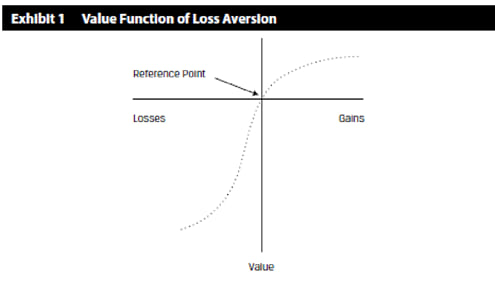
Loss-averse behavior is explained as the evaluation of gains and losses based on a reference point. A value function that passes through this reference point is seen in Exhibit 1 below. The x-axis has gains/losses, and the y-axis has value. Say we have a 5% gain, the positive value is 5 units, but for the same amount of loss, 5%, notice from the exhibit that the value is much higher, say -15 units. So, the value of gain is not symmetric to the value of the loss.
The value function is s-shaped and asymmetric; it has a greater impact of losses than gains for the same variation in absolute value. This utility function implies risk-seeking behavior in the domain of losses (below the horizontal axis) and risk avoidance in the domain of gains (above the horizontal axis).
An important concept based on this utility function is disposition effect: the holding of investments that have experienced losses too long, and the selling of investments that have experienced gains too quickly. Hence the resulting portfolio may be riskier than the one based on the investor’s risk/return objectives.
Consequences of loss aversion:
For example, you bought a stock for 20, and after a while, its price declined to 15. This was a reasonable price to sell, given the fundamental value of the stock. But you held on to the stock in the hope of regaining value rather than recognizing a loss. Such behavior leads to a riskier portfolio than one that was based on risk/return objectives and fundamental analysis.
Here, say you bought a stock that increased by 10%, and you sold it because you were afraid that price would decrease if you held on. As a result, you would trade excessively. Fundamentals should justify your selling decisions.
Detecting and overcoming loss aversion:
Investors demonstrate unwarranted faith in their own intuitive reasoning, judgments, and/or cognitive abilities. For example, people generally think they do a better job of estimating probabilities than they actually do. This is known as illusion of knowledge bias.
The two basic types of overconfidence bias within the illusion of knowledge bias are prediction overconfidence and certainty overconfidence.
Self-attribution bias is a bias in which people take credit for successes and blame exogenous factors (such as bad luck) for failures. This bias can be divided into two subsidiary biases: self-enhancing and self-protecting. Self-enhancing bias describes people’s propensity to claim too much credit for their successes. Self-protecting bias describes the denial of responsibility for failures.
Consequences of overconfidence bias:
Detecting and overcoming overconfidence bias:
Self-control bias is a bias in which people fail to act in their long-term best interest because of a lack of self-discipline. Individuals are impulsive, and there is an inner conflict between short-term satisfaction and achievement of some long-term goals. For example, “People pursuing the CFA charter may fail to study sufficiently because of short-term competing demands on their time.”
Consequences of self-control bias:
Detecting and overcoming self-control bias:
Status quo is an emotional bias in which people do nothing (i.e., maintain the “status quo”) instead of making a change. People are generally lazy and keep things the same. They do not necessarily look for opportunities where a change is beneficial. A phrase commonly used can be understood in the context of status quo, “if it ain’t broke, don’t fix it.” This saying means leave something, avoid correcting or improving it.
Status quo bias is often discussed in tandem with endowment and regret-aversion biases (described later) because the outcome of the biases may be similar. However, the reasons differ among the biases. In the status quo bias, positions are maintained primarily due to inertia rather than conscious choice. In the endowment and regret-aversion biases, the positions are maintained because of conscious, but incorrect choices.
Consequences of status quo bias:
Detecting and overcoming status quo bias:
Endowment bias is an emotional bias in which people value an asset more when they
hold rights to it than when they do not. For example, a person owns his house, and it has a specific value to him. After some time, he decides to buy another house next door, very similar to his house. But he feels the price quoted for it is too high. However, if he were to sell his own house, he would perhaps ask for a higher price. Standard economic theory states that similar assets should be bought/sold at the same price. Because he has lived and owned this house for the past 30 years, endowment bias has affected his attitudes toward it. Effectively, ownership “endows” the asset with added value.
Endowment bias may also occur when someone inherits or purchases securities. The value in their minds is more than what it should be. Consequently, FMPs may irrationally hold on to securities or assets they already own even though it violates the law of one price.
Endowment bias can be combined with the status quo bias. Clients are reluctant to sell securities bequeathed by previous generations.
Consequences of endowment bias:
Detecting and overcoming endowment bias:
Regret-aversion bias is a bias in which people tend to avoid making decisions out of fear that the decision will turn out poorly. For example, many years ago, there was a saying that no one gets fired for selecting IBM. Because IBM was a big company, and it was considered safe to buy merchandise from it. Even if your decision went wrong, you could save face by saying, “I bought from the biggest company,” which is commonly accepted as the appropriate thing to do. Generally, people try to avoid the pain of regret associated with bad decisions. Thus, no action becomes the default decision.
Consequences of regret-aversion bias:
Detecting and overcoming regret-aversion bias:
Traditional finance assumes that markets are efficient, that they instantly and fully incorporate all information into asset prices. However some persistent market patterns such as momentum, value, bubbles, and crashes challenge this assumption. In this section we will use behavioral finance to understand why these patterns occur.
Market anomalies are persistent deviations from the efficient market hypothesis (EMH). Anomalies are identified by persistent abnormal returns that differ from zero and are predictable in direction. Possible explanations of anomalies are:
Despite the challenges, behavioral finance has identified several market anomalies and offered explanations based on individual investors’ behavioral biases. Three such anomalies are momentum, bubbles, and crashes, and value stocks vs. growth stocks.
Momentum (or trending) occurs when future price movements are correlated with recent past prices. Correlation is positive in the short term, up to two years, but for longer periods of two to five years, correlation is negative, and returns revert to the mean.
Why does this phenomenon occur?
Momentum can be partly explained by availability and hindsight biases.
Several studies have found that traders have faulty learning models in which their reasoning is based on their most recent experience. This is also referred to as availability bias. The recency effect is the tendency to recall recent events more vividly and give them undue weight. If the price of a security rises for a period, investors extrapolate this rise to the future. Recency bias causes investors to place too much emphasis on small samples because of the readily available information.
Regret is the feeling that an opportunity has been missed and is related to hindsight bias. Hindsight bias is the tendency to see past events as having been predictable. Suppose a mutual fund or stock did well a year ago; the regret of not owning this well performing asset can drive investors to remedy it by purchasing the asset. These behavioral factors can explain short-term year-on-year trending and overtrading creating a trend-chasing effect. Investors have a bias to buy investments they wish they had owned the previous year.
Bubbles and crashes are defined as periods of unusual positive or negative asset returns. Bubbles and crashes appear to be panics of buying and selling. A continuous increase in asset price is fueled by further expectations of increase; asset prices become decoupled from economic fundamentals. Bubbles typically develop more slowly relative to crashes, which can be rapid. This asymmetry is because of the behavioral factors involved. A crash is a fall of 30% or more in asset prices over several months. Recent examples are the technology bubble of 1999–2000 and the residential property boom of 2005–2007.
Rational and behavioral finance explanations for asset bubbles is given in Example 16. Both managers did not understand the risks involved in the technology stock bubble and exhibited the illusion of control bias.
Example: Investor Behaviour in Bubbles
(This is Example 16 in the curriculum.)
Consider the differing behavior of two managers of major hedge funds during the technology stock bubble of 1998–2000:
The manager of Hedge Fund A was asked why he did not get out of internet stocks earlier even though he knew by December 1999 that technology stocks were overvalued. He replied, “We thought it was the eighth inning, and it was the ninth. I did not think the NASDAQ composite would go down 33% in 15 days.” Faced with losses, and despite his previous strong 12-year record, he resigned as Hedge Fund A’s manager in April 2000.
The manager of Hedge Fund B refused to invest in technology stocks in 1998 and 1999 because he thought they were overvalued. After strong performance over 17 years, Hedge Fund B was dissolved in 2000 because its returns could not keep up with the returns generated by technology stocks.
The behavioral biases associated with bubbles and crashes are
when investors do not update their beliefs sufficiently.
rationalize flawed decisions as a bubble unwinds. Investors may initially be unwilling to accept losses.
Studies show that value stocks outperform growth stocks over long periods. Value stocks are typically characterized by low price-to-earnings ratios, high book-to-market equity, and low price-to-dividend ratios. A growth stock has the opposite characteristics of a value stock. For example, growth stocks are characterized by low book-to-market equity, high price-to-earnings ratios, and high price-to-dividend ratios.
The Fama and French three-factor model incorporates additional factors, size, and value, alongside market beta in their asset pricing model to explain this anomaly and other apparent anomalies. Fama and French claim the value stock anomaly disappears in their three-factor model. They believe that the factors are associated with risk exposures that show the greater potential to suffer distress during economic downturns. In other words, it is not the mispricing of value and growth stocks that lead to the difference in their performance but the difference in risk between the two classes of stocks.
Some studies present anomalies as mispricing rather than risk. These studies identify the emotional factors involved in valuing stocks. The halo effect, for example, is based on a favorable evaluation of some characteristics relative to others. This view is related to representativeness that can lead investors to extrapolate recent past performance into
future returns. A company with a sound growth track and share price performance might be seen as a good investment with higher returns than its risk would merit. This means that the risk of growth stocks is underestimated.
Emotions play a role in estimating risk and expected return of stocks. An emotional rating in a company leads investors to perceive the company’s stock as less risky. Although the capital asset pricing model assumes risk and expected return are positively correlated, many investors behave as if the correlation is negative, expecting higher returns with lower risk.
The emotional attraction of a stock can be enhanced by personal experience of products, the brand’s value, and the proximity of its head offices to the analyst or investor. This last issue is known as the home bias anomaly, whereby domestic securities are favored over international securities in global portfolios.


Ace the Exam with Active Learning!

Ace the Exam with IFT Notes!

Practice your way to success!

Accelerate your studies!
 Do IFT Mocks to make you exam-ready!


Sign up to get more!