
In this reading, we will discuss:

This is a repetition of what we have seen in the previous reading. When a risk-free asset is combined with a risky asset, it results in higher risk adjusted returns because the risk-free asset has zero correlation with the risky asset. This leads to the capital allocation line.
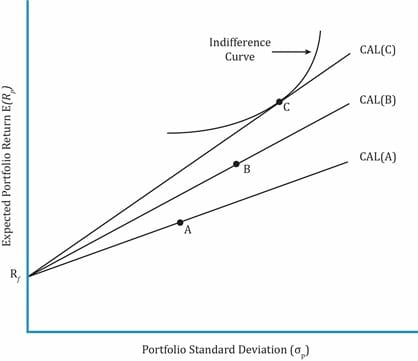
Investors have different views of the market (and different levels of risk aversion) which means the individual risky assets (e.g. securities) they choose to form their portfolio are different. Combining the capital allocation line with an investor’s indifference curve leads to different optimal risky portfolios, as illustrated in the exhibit below.
We now explore whether a unique optimal risky portfolio exists for all investors. The answer is yes, if there is homogeneity of expectations.
What is homogeneity of expectations?
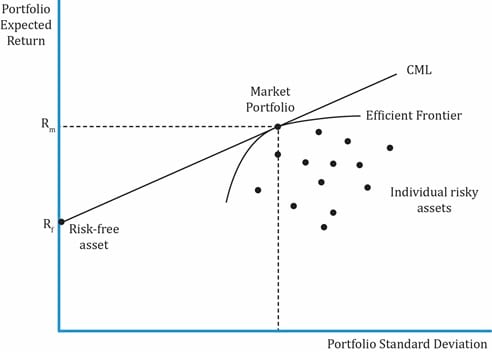
Since all investors have the same expectations, they will construct only one efficient frontier. If there is one efficient frontier, there will be only one capital allocation line. The point where this capital allocation line is tangential to the efficient frontier is called the market portfolio. This is the optimal risky portfolio when all investors have the same expectations. The CML is a special case of the CAL where the efficient portfolio is the market portfolio.
Now, let us derive the equation for CML. We will use a basic equation of the form: Y = C + mX
where:
Y= Rp (portfolio return)
C = Rf (risk-free rate)
m = slope = (Rm – Rf) / ?m
X = portfolio standard deviation = ?p
The equation for CML can be written as

Any point along the CML is a combination of the risk-free asset and the market portfolio. At the point where the CML intersects y-axis, 100% is invested in the risk-free asset and its weight decreases as we go up along the CML.
What is the market?
Theoretically, the market includes all risky assets or anything that has value. Examples include stocks, bonds, real estate, etc.
The market portfolio should contain as many assets as possible, but it is not practical to include all assets in a single risky portfolio because not all assets are tradable and not all tradable assets are investable. Examples of non-tradable assets include the Eiffel Tower and human capital. Examples of tradable assets that are not investable include Class A shares on the Shanghai Stock Exchange that are not available for foreign investors.
Practically, we use major stock market indexes as a proxy for the market. This reading uses the S&P 500 index as the market’s proxy as it represents approximately 80% of the U.S stock market capitalization and U.S. markets account for nearly 32 per cent of the world markets.
Example
Majid Khan wants to build a portfolio using T-bills and an index fund that tracks the KSE 100 Index. The T-bills have a return of 10%. The index fund has an expected return of 16% and a standard deviation of 30%. Draw the CML. Show the point where the investment in the market is 75%. What is the risk and return at this point?
Solution:
Risk and return when the investment in the market is 75%:
= 0.75 * 30 = 22.5% (Note: Risk of T-bills is zero)
= 0.25 x 10 + 0.75 x 16 = 14.5%
Let us now plot these values on the CML.
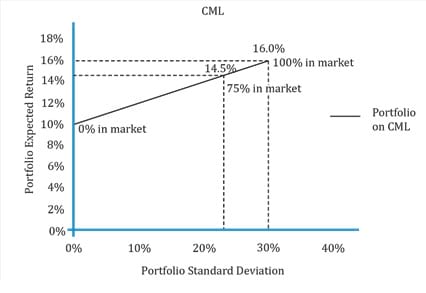
When the return on the portfolio is 10%, Majid is holding 100% of the T-bills and 0% of the market portfolio. As he increases his weight in the market portfolio to 75%, we see that the return has changed to 14.5% but his risk has also gone down to 22.5%. When he has invested 100% in the market portfolio, the risk and return are the same as the market portfolio.
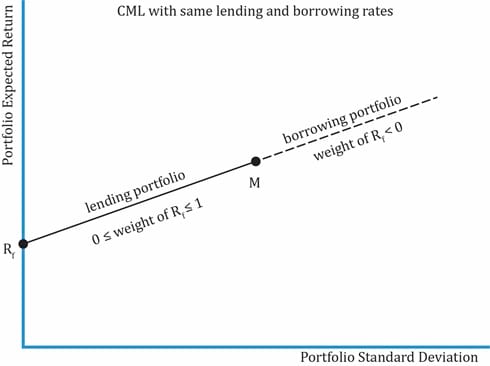
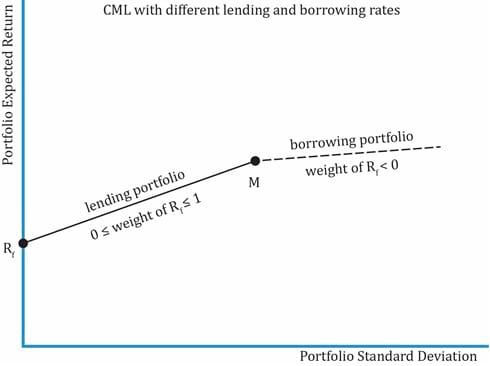
Our focus so far has been on the portfolios between the points Rf , the risk-free asset, and M, the market portfolio on the CML, where an investor is holding some combination of the two assets. The portfolios on this stretch between Rf and M are called lending portfolios because the investment in the assets comes from the investor’s own wealth. He is lending (investing) his wealth at the risk-free rate.
The dotted line in the exhibit below stretches beyond M on the CML represents the borrowing portfolios. This means that the investor is able to borrow money at the risk-free rate to invest more in the market portfolio.
 .
.Different lending and borrowing rates
Often, investors are not able to borrow money at the risk-free rate. If the borrowing rate is higher than the risk-free rate, the CML is no longer a straight line. The slope of the line to the right of M is given by:  . Hence, there is a ‘kink’ in the CML. This is illustrated in the exhibit below. Using the data from the previous example, the slope of CML when borrowing rate is the same as lending rate, we get slope as
  = 0.2. Now, assume the borrowing rate is higher at 12%. The slope in this case will be
  = 0.133, which is less than 0.2.
When the borrowing rate is higher than the lending rate, the return per unit of risk is less relative to when the borrowing rate is equal to the lending rate.
Example
After a successful initial foray into the stock market, Majid Khan gets a little greedy and decides to build a leveraged portfolio. He invests 100,000 of his own money and 50,000 of borrowed money in the index fund. He expects to pay 10% on the borrowed money. The index fund has an expected return of 16% and a standard deviation of 30%. Calculate his expected risk and return.
Solution:
w1 = Weight of the risk-free asset = Weight of borrowed money = -50,000/100,000 = -0.5
w2 = Weight in risky asset = 150,000/100,000 = 1.5
Total weight = w1 + w2 = 1.5 – 0.5 = 1
Expected return with -50% invested in T-bills = w1Rb + w2Rm = -0.5 (10) + 1.5 (16) = 19%.
Standard deviation with -50% invested in T-bills is w2 x ?m = 1.5 x 30 = 45%.
This example shows us that leverage amplifies both expected return and risk.
Example
Calculate the expected return and risk if Majid actually needs to pay 12% on the borrowed money. All other numbers are the same.
Solution:
The standard deviation or risk of the portfolio remains the same. But the expected return must be lower as the borrowing rate has increased. Let us calculate the slope of the borrowing part of the CML as = = 4/30.
Expected return = 12% + (16 – 12)/30 * 45 = 18%.
Or, expected return with -50% invested in T-bills = w1Rb + w2Rm = -0.5 (12) + 1.5 (16) = 18%.
Standard deviation with -50% invested in T-bills ?p = w2 * ?M =1.5 * 30 = 45%.


Ace the Exam with IFT Notes!

Ace the Exam with Active Learning!

Accelerate your studies!
 Do IFT Mocks to make you exam-ready!

Practice your way to success!


Sign up to get more!