
Technical indicators are used to derive additional information from basic chart patterns. There are three kinds of technical indicators that we will discuss; price-based indicators, momentum oscillators, and sentiment indicators.
Price-based indicators
They incorporate the information contained in the current and past market prices. The common types are:
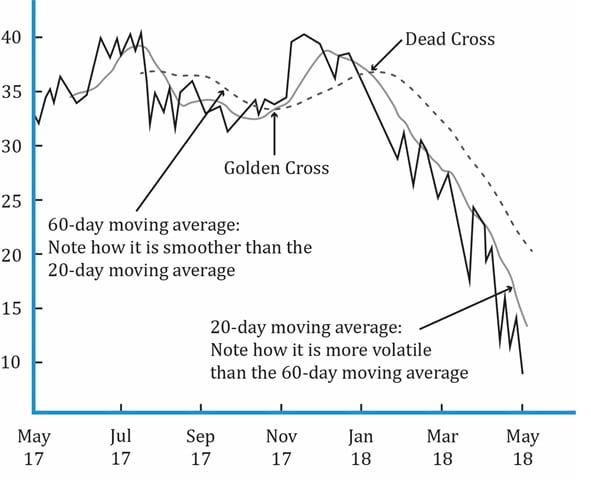
Moving average:
It is the average of the closing prices over a specified number of periods. They are used to smooth out short-term price fluctuations and help identify the trend. When a short-term moving average crosses from underneath a longer-term average, this movement is considered bullish and is known as a golden cross. When a short-term moving average crosses from above a longer-term average, this movement is considered bearish and is known as a dead cross.
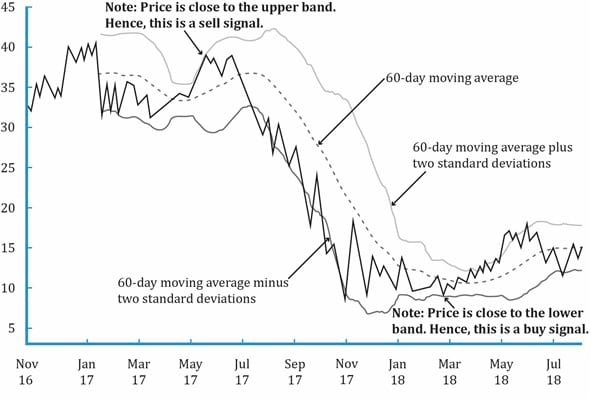
Bollinger bands:
Bollinger bands consist of a moving average plus a higher line representing a set number of standard deviations and a lower line representing a set number of standard deviations. Typically, the higher and lower lines are drawn two standard deviations away from the n-period moving average. The figure below shows a Bollinger band and a moving average.
A common use of a Bollinger band is to create trading strategies such as a contrarian strategy. In this strategy, an investor sells when a security’s price reaches the upper band and buys when it reaches the lower band. The contrarian strategy assumes that the security’s price will stay within the bands.
If the security becomes more volatile the Bollinger bands become wider. If the security becomes less volatile the Bollinger bands become narrower. Bollinger band width is an indicator derived from Bollinger Bands. It is calculated as:
Bollinger Band width = [(Upper band – Lower band)/Middle band] × 100
This indicator is generally used to identify a ‘squeeze’ – when volatility falls to very low levels and prices are expected to break out.
Momentum oscillators
It is difficult to identify unusual changes in price movements with price-based indicators. Momentum oscillators help overcome this problem. They are based on rate of change in price data, but are scaled to make them ‘oscillate’ around a value, such as ‘0’, or between two values, such as ‘0’ and ‘100’. Extremely high and extremely low oscillator values indicate overbought or oversold market conditions.
Technical analysts also look for convergence or divergence between oscillators and price. ‘Convergence’ occurs when the oscillator and prices move together (for example, both making higher highs). ‘Divergence’ occurs when oscillator and prices move in different directions. Convergence indicates that the price trend is likely to continue. Whereas, divergence indicates that the price trend is likely to reverse.
Three main uses of oscillators are:
The commonly used momentum oscillators are:
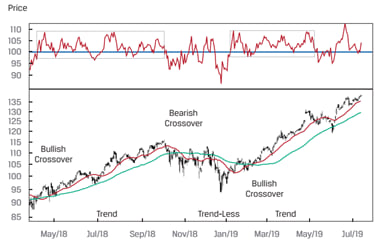
The rate of change (ROC) oscillator is calculated as:
100 x (Most recent closing price – Closing price n days ago).
Calculated this way, it oscillates around zero. When the ROC oscillator crosses zero into the positive territory, during an uptrend, it is considered bullish. When the ROC oscillator crosses zero into the negative territory, during a downtrend, it is considered bearish.
Sometimes, the ROC oscillator is set to oscillate around 100 instead of 0, by calculating it as:
100 x (Most recent closing price/Closing price n days ago)
The figure below shows a ROC oscillator with 100 as the midpoint. Short-term and long-term moving averages are also plotted. During trend periods, the ROC oscillator moves in a narrow range between 100 and 110. So once the uptrend is confirmed with a bullish crossover, we can use the ROC oscillator to time the minor peaks and troughs in the uptrend. During trendless periods, the ROC oscillator moves in a wide range between 80 and 110. Timing entry and exit is difficult during such periods.
Relative strength index (RSI) is used to measure the inner momentum of a security. It is calculated as the ratio of the magnitude of ‘up days’ to the magnitude of ‘down days’ of that security across a given time period. A popular time period used is 14 days.
RSI=100 – [100/(1+RS)]
where:
RS = [(Up changes for the period under consideration)/(Down changes for the period under consideration)]
The value of the RSI is always between 0 and 100. A value above 70 represents an overbought situation while a value below 30 suggests that an asset is oversold.
The figure below shows a sample chart with RSI.
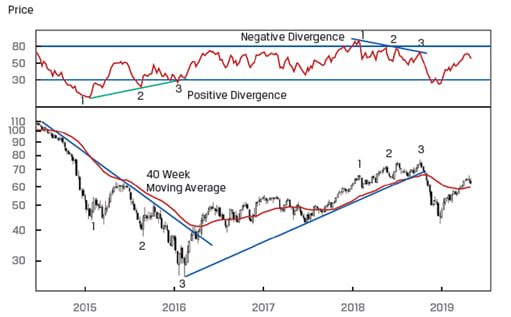
A positive divergence occurs when the security price reaches a new low but the RSI reaches a higher low. This scenario indicates that while the price is reaching a new low, the inner momentum is improving; in other words, the selling pressure is decreasing.
A negative divergence occurs when the security price reaches a new high but the RSI fails to reach a new high. This scenario indicates that while the price is reaching a new high, the inner momentum is fading; in other words, buying pressure is decreasing.
Instructor’s Note: The RSI should not be confused with ‘relative strength analysis’. RSI is used to measure the internal strength of a single asset. Whereas, relative strength analysis compares the relative performance of two assets.
It is based on the observation that in uptrends, prices tend to close at or near the high end of their recent range. Similarly, in downtrends, they tend to close near the low end. It is composed of two lines, called %K and %D that are calculated as follows:
%K = 100 
where:
C = latest closing price
L14 = lowest price in past 14 days
H14 = highest price in past 14 days
%D = average of the last three %K values calculated daily
The stochastic oscillator has a default setting of 14-days.
%D is like a long-term moving average and is also called the signal line. It oscillates between 0 and 100. Generally, values between 20 and 80 are considered short term noise. Values above 80 are considered bearish as they indicate overbought conditions. Similarly, values below 20 are considered bullish as they indicate oversold conditions.
When the %K moves from below the %D line to above it, this move is considered a bullish signal. On the other hand, when %K moves from above the %D line to below it, this pattern is considered bearish.
Stochastic oscillator should be used with other technical tools such as trend analysis, pattern analysis and RSI analysis. If multiple tools give us the same signal, then we can consider it to be a strong signal.
A sample chart with a stochastic oscillator is shown below.
It is the difference between a short-term and a long-term moving average of the security’s price. It is composed of two lines – MACD line and signal line.
The indicator oscillates around 0 and has no upper or lower limit.
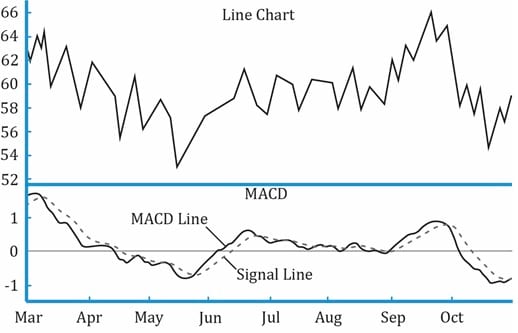
MACD is used in technical analysis in three ways.
Instructor’s Note:
The most known use of momentum oscillators is to indicate the overbought or oversold position of a security. Thus, they help in providing signal for buying or selling security but do not help to set the target price.
They gauge investor activity for signs of bullishness or bearishness. The two types
of sentiment indicators are investor polls and calculated statistical indexes:
Calculated statistical indices: They are calculated from market data, such as security prices. The common types are:
The ratio is often viewed as a contrarian indicator. An extremely high value indicates an oversold market. Whereas, an extremely low value indicates an overbought market.
VIX is generally interpreted from a contrarian perspective and used with other trend, pattern, and oscillator tools. When other tools indicate an oversold condition and the VIX is at an extreme high, this combination is considered bullish.


Ace the Exam with IFT Notes!

Ace the Exam with Active Learning!

Accelerate your studies!
 Do IFT Mocks to make you exam-ready!

Practice your way to success!


Sign up to get more!