
Portfolio risk depends on:
Portfolio Return
A portfolio is usually composed of more than one asset in different proportions. Portfolio return is the weighted average of the returns of the individual investments.
Assume you have three different stocks A, B, and C in your portfolio with weights of 50%, 25%, and 25% respectively. The returns on A, B, and C are 20%, 10%, and 10% respectively. The portfolio return is the weighted average return of three stocks: = 15%.
Risk of a two-asset portfolio is given by:


where:  = correlation coefficient that gives the correlation between returns R1 and R2.
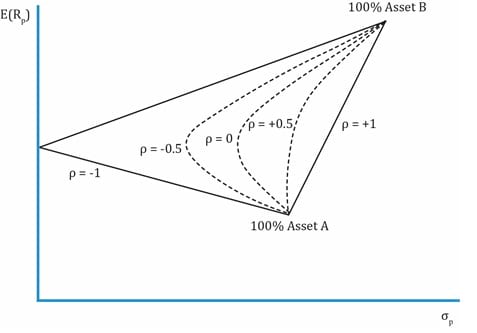
Impact of correlation on portfolio risk
As correlation decreases, the diversification benefit increases i.e. the risk of the portfolio decreases.
Example
Let us revisit our portfolio of X and Y. Earlier, we considered the impact of changing weights of the two assets. Now, we will also consider the impact of different correlations. The relevant data is reproduced here. X has an expected return of 12% and a standard deviation of 16%. Y has an expected return of 20% and a standard deviation of 30%. What is the expected return and risk of the portfolio for different weights assuming the following correlations: -1, -0.5, 0, 0.5, and 1?
Solution:
Rp = wx Rx+ wy Ry ?p2 =  |
||||||
| Rx = 12%, ?x = 16%; Ry = 20%; ?y = 30% | ||||||
| Weight of X (%) | Portfolio return | Portfolio risk when correlation between X and Y is: | ||||
| -1 | -0.5 | 0 | 0.5 | 1 | ||
| 0 | 20 | 30 | 30 | 30 | 30 | 30 |
| 20 | 18.4 | 20.8 | 22.5 | 24.2 | 25.7 | 27.2 |
| 50 | 16 | 7 | 13 | 17 | 20.2 | 23 |
| 60 | 15.2 | 2.4 | 10.9 | 15.4 | 18.7 | 21.6 |
| 70 | 14.4 | 2.2 | 10.28 | 14.3 | 17.5 | 20.2 |
| 100 | 12 | 16 | 16 | 16 | 16 | 16 |
This chart is not exhaustive. It is plotted only for the weights used above.
In the previous example, we saw how a two-asset portfolio’s risk reduces as the correlation between the assets decreases. To be more generic, for a portfolio with more than two assets, the variance is given by:

where:
 = portfolio variance
 = average variance
 = average covariance
N = number of assets in the portfolio
Instructor’s tip:
The probability of being tested on this formula is low.
When creating a diversified portfolio, the choice of assets and the correlation among assets is important. Adding perfectly positively correlated assets to a portfolio does little to reduce the portfolio’s risk. Similarly, assets that have lower correlations will reduce risk. When two assets with a correlation of -1.0 are combined to form a portfolio, risk can be reduced to zero.


Ace the Exam with IFT Notes!

Ace the Exam with Active Learning!

Practice your way to success!
 Do IFT Mocks to make you exam-ready!

Accelerate your studies!


Sign up to get more!