Inter-market analysis is based on the principle that all markets (namely equities, bonds, currencies and commodities) are interrelated and influence each other. Here, technicians look for inflection points in one market as a warning sign to start looking for a change in another related market. To identify these inter-market relationships, a commonly used tool is the relative strength analysis (covered earlier).
Relative strength analysis can be used in many ways such as:
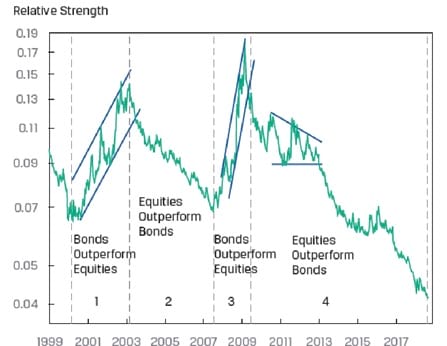
The following chart compares the relative strength of 10-year treasury bonds with S&P 500.

The chart shows clear periods of both outperformance and underperformance of T-bonds relative to the S&P 500. Inflection points in this chart occur in 2000, 2003, 2007, and 2009. These points could have been used as signals to move funds between these asset classes.
Relative strength analysis can be used to further identify the strongest performing sectors within an asset class; and the strongest performing securities within that sector.
Inter-market analysis can also help measure the relative performance of major equity benchmarks from different countries. These observations can help decide how much funds to allocate across different countries.
Technical analysis can use either a top-down approach or a bottom-up approach to analyze securities.
Top-down approach: The top-down approach focuses on how the overall economy affects different sectors or industries. Intermarket analysis and relative strength analysis help identify outperforming asset classes, countries, or sectors. Technicians try to identify major inflection points or changes in trends. This approach can help make tactical asset allocation decisions. Tactical asset allocation (TAA) refers to a portfolio strategy that changes the allocations to different categories in the short term to take advantage of market opportunities.
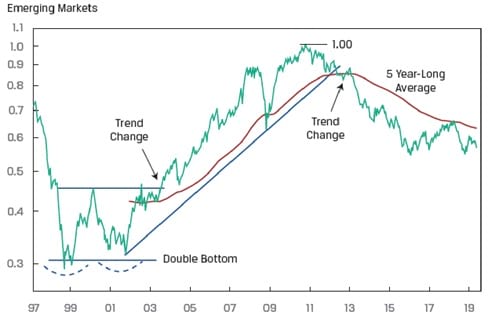
For example, consider the below chart which shows the relative strength for the Emerging Markets Index and the All Country World Index.

The two major inflection points are:
These inflections points could have been used to temporarily increase allocation to emerging market equity.
Bottom-up approach: The bottom-up approach uses rules and conditions to identify investment opportunities. It is useful for identifying individual stocks, commodities, or currencies that are outperforming, irrespective of market, industry, or macro trends.
A typical bottom-up approach consists of the following steps:
Step 1: Identify the investment universe, for example developed market equity
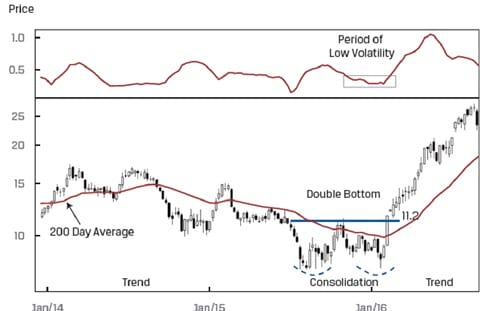
Step 2: Define the selection criteria, for example:
A computer program will help identify stocks that meet all four criteria. An example is shown below:

A technical analyst can serve a supporting role in a team of investors. The technician can add value by identifying investment opportunities through either top-down or bottom-up analysis, depending on the nature of the investment firm or fund. The technician should follow a purist approach, and should not be influenced by other inputs such as the fundamentals of the company.
A technician’s main contribution would be providing input on the timing of the purchase or sale of a security. The technician can also provide a rationale for the expected move, price targets and the price level at which the analysis would be invalidated.
A technical analyst will typically not be directly involved in position sizing decisions.