IFT Notes for Level I CFA® Program
LM06 Fundamentals of Credit Analysis
Part 2
6. Credit Risk vs. Return: Yields and Spreads
We saw in equity that high risk meant a higher potential return. Similarly, issues with lower credit ratings offer higher yields. The higher the credit risk, the higher the return potential, and the higher the volatility of that return. The realized return will be different because interest rates change over time.
As you can see in the exhibit below, junk bonds rated Caa offered the highest return, but also experienced the highest volatility. In contrast, the average return of high-quality investment grade bonds was the lowest at 6.18%. But, they were also the least volatile.
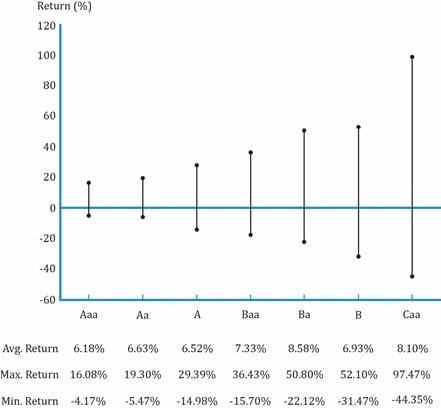
Source: CFA Program Curriculum, Fundamentals of Credit Analysis
Yield on corporate bond
The yields on extremely liquid bonds with virtually no default risk (e.g., government bonds) will be equal to real interest rate plus a premium for expected inflation.
The yields on corporate bonds will include an additional risk premium that compensates investors for credit and liquidity risk and possibly the tax impact of holding a specific bond. This additional risk premium is called a spread.
Factors that affect the spread on corporate bonds:
- Credit cycle: Credit spreads narrow when the credit cycle improves; a spread is narrower at the top of a credit cycle. Credit spreads widen when the credit cycle deteriorates as seen during the recent credit crisis after 2008.
- Broader economic conditions: Credit spreads widen in a weak economy and narrow in a strong economy.
- Funding availability in the financial sector: Unlike stocks that primarily trade on exchanges, bonds usually trade over the counter. Brokers and dealers are market makers in the debt market. Yield spreads are narrow when brokers-dealers provide sufficient capital. However, at times of crisis as seen during the post-2008 period, many broker-dealer firms either closed down or were acquired. The capital available for making markets reduced substantially leading to wider spreads.
- General market supply and demand: If the supply is more and demand is less, credit spreads will widen. Conversely, if the demand is high and supply is low, then spreads tighten.
- Financial performance of the issuer: Earnings releases, news, and other developments associated with the issuer affect credit spreads. Good news will narrow spreads while bad news will widen spreads.
A number of these factors caused spreads to widen dramatically during the 2008-2009 global financial crisis.
6.1 Credit Risk vs. Return: The Price Impact of Spread Changes
How changes in spread affect the price and return of a bond:
Two factors that affect the return on a bond are:
- Modified duration: Price sensitivity to interest rate changes.
- Magnitude of the spread change.
Return impact is calculated using these formulae:
Return impact with and without convexity adjustment
For small changes in yield:
Return impact (without convexity adjustment) ≈ -ModDur x Δspread
For large changes in yield:
Return impact (with convexity adjustment) ≈ – (ModDur x Δspread) + 
where MDur is the modified duration
Note: Negative sign indicates that bond prices and yields move in opposite directions.
| Relationship between spread changes, duration for credit-risky bonds |
| Spread changes |
Bond return/price |
Modified Duration |
| Narrow |
Positive (higher) |
|
| Wider |
Negative (lower) |
|
| Higher spread sensitivity |
Greater price volatility |
Higher/longer |
7. High-Yield, Sovereign, and Non-Sovereign Credit Analysis
What is important from a credit analyst and an investor’s perspective when investing in corporate bonds: to choose high-quality, investment-grade bonds. Can the same credit analysis principles we have seen so far be applied to evaluate other credit-risky bonds as well? Yes, to an extent, but there are differences. We look at three market segments: high-yield corporate bonds, sovereign bonds, and municipal bonds.
7.1. High Yield
These are non-investment grade, junk bonds that are rated below Baa3/BBB by most agencies.
Why do bonds issued by some companies get junk status?
Instructor’s Note: Remember the points from the four Cs in credit analysis that an investment-grade bond must have. This list is just the opposite of that.
- Highly leveraged capital structure.
- Limited or negative free cash flow (no capacity).
- Weak or limited operating history.
- Highly cyclical business.
- Poor management (poor character).
- Risky financial policies.
- Declining industry.
- Lack of competitive advantages.
If the bond is at a risk of default, then the analysis must be more detailed than for an investment-grade bond. The factors a credit analyst must focus on for a high-yield bond are as follows:
- Liquidity and cash flow.
- Detailed financial projections.
- Debt structure.
- Issuer’s corporate structure.
- Equity-like approach to high-yield analysis.
Let us look at each of the points in detail now:
Liquidity
- Investment grade companies have cash on their balance sheets or committed sources of capital to roll over maturing debt.
- High-yield companies may not have access to debt/equity markets or other sources of capital.
- Sources of liquidity (listed below are sources ordered from strongest to weakest) for a high-yield company must be analyzed:
- Cash on the balance sheet – most reliable.
- Working capital.
- Operating cash flow.
- Bank credit facilities.
- Equity issuance – not reliable if market conditions are bad.
- Asset sales – least reliable.
Cause of concern/warning sign:
- Debt coming due in the next 6 to 12 months with low sources of liquidity.
Detailed financial projections
- Forecast future earnings and cash flow under different stress scenarios to see if credit profile is improving, stable, or declining.
- Must take into account ongoing capital expenditures.
Debt structure
- High-yield companies issue debt with varying levels of seniority (second lien, senior unsecured, subordinated, preferred stock). It is important to understand the debt structure – how much debt is senior and subordinated? Within senior debt, how much is secured and unsecured?
- Leverage (calculated as Debt/EBITDA ratio) must be calculated at each level of debt to determine the recovery rate if default occurs. Leverage can either be calculated as gross or net leverage. Gross leverage includes cash. In net leverage, cash is subtracted from debt and calculated as (Debt-cash)/EBITDA.
- The lower the ranking → the lower the credit rating → the lower the expected recovery rate.
Corporate structure
- High-yield investors must analyze an issuer’s corporate structure and distribution of debt between the parent and its subsidiaries. Is the corporate structure complex?
- How does the cash flow between the parent (holding company) and its subsidiaries – subsidiary to parent, or parent to subsidiary?
- Is the issuer a holding company? Do the holding company’s subsidiaries have outstanding debt? How are the leverage ratios for each debt-issuing entity?
Covenant analysis
The covenants for high-yield issuer may include:
- Change of control put: If the issuer gets acquired, then this clause requires the issuer to buy back the debt from investors either at par or small premium to par. The objective is to protect them from a downgrade after acquisition or a weaker acquirer.
- Restricted payments: Defines how much cash can be paid to shareholders over time.
- Limitations on liens and additional indebtedness: Defines how much secured debt an issuer can have. The objective is to protect unsecured bondholders in the event of default by not having too many secured layers above them.
- Restricted versus unrestricted subsidiaries: Subsidiaries are classified as restricted and unrestricted. Certain subsidiaries with significant assets may be classified as restricted to help service parent-level debt.
Equity-like approach to high-yield analysis
- Risk and return profile of high-yield bonds falls somewhere in between high-quality investment grade bonds and stocks.
- So, analyzing high-yield bonds like equities is useful.
- Credit analysts may analyze high-yield bonds by calculating enterprise value = equity market capitalization + total debt – cash.
- Then, they may compare EV/EBITDA and Debt/EBITDA of different issuers as part of their analysis.
7.2. Sovereign Debt
Governments issue sovereign debt to finance public projects such as infrastructure, education, and airports, and to pay wages to government employees.
Types of debt issued by governments:
- Local (internal) debt: Issued in the sovereign’s own currency: easier to service as the government can print money or raise taxes.
- External debt: Not denominated in the sovereign’s currency but some other currency, like the U.S. dollar.
Characteristics of sovereign debt:
- Historically viewed as risk-free, but that is changing as seen post-2008. Many Eurozone countries such as Greece and Spain were on the verge of default.
- Best able to service debt if a sovereign runs twin surplus (current account surplus and budget surplus).
- Two key issues to consider in sovereign analysis: the government’s ability to pay and willingness to pay.
- Credit rating agencies distinguish between local currency debt and foreign currency debt. Rating agencies usually assign a higher rating to local currency debt relative to foreign currency debt.
Given below is a framework (adapted from S&P’s methodology) to evaluate sovereign credit and assign sovereign debt ratings:
| Framework for sovereign credit analysis |
| Political and economic profile |
Flexibility and performance profile |
Institutional effectiveness and political risks
- How were past political, economic, financial crises handled?
- Is there consistency in policy framework?
- Is the government corrupt?
- Is the media biased/compromised?
- What is the willingness to implement reforms?
|
External liquidity and international investment position
- Low external debt → better able to service foreign currency debt.
- Actively traded currency → less impacted by adverse shifts in global investor portfolios (e.g. U.S. Dollar).
|
Economic structure and growth prospects
- How is the income per capita? Higher income per capita means a deeper tax base.
- Size of public sector to private sector. The public sector should be smaller compared to the private sector.
- Age of population. Young population –> expanding tax base, and contributes to GDP. Japan has an ageing population that puts pressure on health care and social services.
|
Fiscal performance, flexibility, and debt burden
- Decline in government debt/GDP → strong credit.
- If
 < 5%, then it is good. > 15% is poor. < 5%, then it is good. > 15% is poor.
 < 30% is good. < 30% is good.
|
|
Monetary flexibility
- What is the exchange rate policy (listed in order of maximum independence/effectiveness) – free floating currency, fixed rate or a hard peg?
- Central bank
- Is the bank independent or does the government influence its monetary policy?
- Is controlling inflation (low, stable levels) the objective?
- How developed is the banking system?
|
Source: CFAI Curriculum
7.3. Non-Sovereign Government Debt
Non-sovereign government debt is debt issued by state, provincial, and local governments. It generally refers to U.S. municipal bonds and consists of tax-exempt and (a small portion of) taxable bonds.
General obligation bonds
- GO bonds are unsecured and issued with the full faith and credit of issuing government.
- Credit analysis focuses on employment, per capita income, per capita debt, tax base, etc.
- Over-reliance on one or two types of tax revenue (e.g., capital gains or sales tax) can signal credit risk.
Revenue bonds
- Issued for specific project financing like toll road, bridge, etc.
- Credit analysis is similar to corporate bonds.
- Higher risk than GO bonds because of a single source of revenue.
- A key metric to calculate: debt-service-coverage ratio (DSCR), i.e., how much revenue to cover debt service payments.
The higher the DSCR, the stronger the creditworthiness.
Share on :


 Do IFT Mocks to make you exam-ready!


