
Liquidity ratios measure a company’s ability to meet short term obligations. It also indicates how quickly it turns assets into cash.
| Liquidity Ratios | ||
| Current ratio |
 |
Higher number implies greater liquidity. |
| Quick ratio |
 |
Higher number implies greater liquidity.
More conservative than current ratio as only more liquid current assets are included. |
| Cash ratio |
 |
This is the most conservative liquidity ratio, and a good measure of a company’s ability to handle a crisis situation. |
| Defensive interval ratio |
 |
Measures the number of days a company can operate before it runs out of cash.
Higher number implies greater liquidity. |
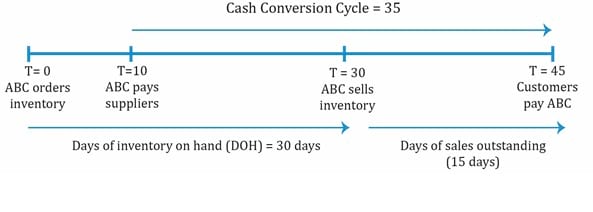
| Cash conversion cycle (net operating cycle) |
Days of inventory on hand (DOH) + Days of sales outstanding (DSO) – Number of days of payables
|
The time between cash paid (to suppliers) and cash collected (from customers).
A low number is better for the company as it means high liquidity. Long cash conversion cycle implies low liquidity |
The example below for ABC Corp. illustrates the cash conversion cycle. The timeline for various events is illustrated below:
Solvency ratios measure a company’s ability to meet long term obligations. In simple terms, it provides information on how much debt the company has taken and if it is profitable enough to pay the interest on debt in the long term. It has to be analyzed within an industry’s perspective. Certain industries such as real estate use a higher level of leverage.
| Solvency Ratios | Formula | Interpretation |
| Debt ratios | ||
| Debt to assets ratio |
 |
Measures the amount of debt in total assets.
Higher debt means low solvency and higher risk. A ratio of 0.5 implies 50% of assets are financed with debt. |
| Debt to capital ratio |
 |
Measures the amount of debt as a percentage of capital (debt + shareholder’s equity). |
| Debt to equity ratio |
 |
Measures the amount of debt as a percentage of equity. |
| Financial leverage ratio |
 |
Measures the amount of assets per unit of equity.
Higher value means company is more leveraged. |
| Coverage ratios | ||
| Interest coverage ratio (also called ‘times interest earned’ |
 |
Measures the company’s ability to make interest payments (how many times the company can make interest payments with its EBIT).
Unlike the other solvency ratios, higher value for this ratio is better as it means stronger solvency. |
| Fixed charge coverage ratio |
 |
Measures the ability of a company to pay interest on debt.
Here, lease payments are added to EBIT as they are an obligation like interest payments. Like interest coverage ratio, higher value for this ratio implies stronger solvency. |
Note that there are two categories of solvency ratios: debt (or leverage) ratios and coverage ratios.
In general, a high debt (or leverage) ratio implies a high level of debt, high risk and low solvency. With coverage ratios, a high number is good because this indicates high income relative to interest payments.
| Profitability ratio | Formula | Interpretation |
| Return on Sales | ||
| Gross profit margin |
 |
Higher value means higher pricing and lower costs. |
| Operating profit margin |
 |
Operating profit = gross profit – operating costs.
Good sign if operating profit margin grows at a faster rate than gross profit margin. |
| Pretax margin |
 |
EBT = operating profit – interest related expenses.
Needs further analysis if pretax income increases only because of non-operating income. |
| Net profit margin |
 |
Net profit = revenue – all expenses. |
| Return on Investment | ||
| Operating ROA |
 |
For return, either net income or operating income (EBIT) can be used. |
| Return on assets (ROA) |
 |
For return, either net income or operating income (EBIT) can be used. |
| Return on total capital |
 |
Like operating ROA, EBIT is used. Measures return on capital before deducting interest. |
| Return on equity (ROE) |
 |
A very important measure of return earned on equity capital. Unlike return on common equity, it includes minority and preferred equity. |
| Return on common equity |
 |
Money available to common shareholders. |
DuPont Analysis: The Decomposition of ROE
DuPont analysis decomposes a firm’s ROE to better analyze a firm’s performance.
Start with ROE

Traditional DuPont equation is


Extended DuPont equation is


Example
The following data is available for a company:
| 2010 | 2011 | 2012 | |
| ROE | 19% | 20% | 22% |
| ROA | 8.1% | 8% | 7.9% |
| Total asset turnover | 2 | 2 | 2.1 |
Based only on the information above, the most appropriate conclusion is that over the period 2010 to 2012, the company’s:
Solution:
A quick glance at the data says profitability is going up and asset turnover has slightly increased from 2010 to 2012. ROA is going down from the second year.
First, break down ROE into: 
ROE is going up (first row). Since ROA is going down, leverage must increase for ROE to increase. So A is incorrect.
Next, to determine if net profit margin increased or decreased, break down ROA into  . Since
  or asset turnover is increasing, net profit margin has to decrease for return on assets to decrease. So, the correct answer is C.


Ace the Exam with IFT Notes!

Ace the Exam with Active Learning!

Accelerate your studies!
 Do IFT Mocks to make you exam-ready!

Practice your way to success!


Sign up to get more!