
Evaluation of the cash flow statement should involve the following:
In common-size analysis of a company’s cash flow statement, there are two alternative approaches. In the first approach, we express each line item of cash inflow (outflow) as a percentage of total inflows (outflows). An example of a common-size cash flow statement using this approach is shown below for K2 Corp.
| Inflows | Actual | % of Total Inflow |
| Net cash provided by operating activities | 3,200 | 80 % |
| Sale of Equipment | 800 | 20% |
| Total | 4,000 | 100% |
| Outflows | Actual | % of Total Outflow |
| Purchase of equipment | 1,500 | 36.58% |
| Retirement of long-term debt | 500 | 12.19% |
| Retirement of common stock | 325 | 7.9% |
| Dividend payments | 1,775 | 43.29% |
| Total | 4,100 | 100% |
| Net increase (decrease) in cash | (100) |
In the second approach, we express each line item as a percentage of revenue. An example of such a statement is shown below for K2 Corp. In this example, we have assumed total revenue is 10,000.
| Cash flow | Actual | % of Total Revenue |
| Cash flow from operating activities | ||
| Net Income | 4,000 | 40% |
| Depreciation expense | 500 | 5% |
| Increase in accounts receivable | (500) | (5%) |
| Increase in inventory | (1,000) | (10%) |
| Decrease in prepaid expenses | 1,000 | 10% |
| Increases in accounts payable | 500 | 5% |
| Increases in accrued liabilities | 500 | 5% |
| Net cash provided by operating activities | 5,000 | 50% |
| Cash flow from investing activities | ||
| Cash received from sale of equipment | 2,000 | 20% |
| Cash paid for purchase of equipment | (5,000) | 50% |
| Net cash used for investing activities | (3,000) | (30%) |
| Cash flow from financing activities | ||
| Sale of bonds | 1,000 | 10% |
| Cash dividends | (2,000) | (20%) |
| Net cash used for financing activities | (1,000) | (10%) |
| Net increase in cash | 1,000 | 10% |
The common-size cash flow statement makes it easier to see trends in cash flow rather than just looking at the total amount. The second approach is useful for the analyst in forecasting future cash flows.
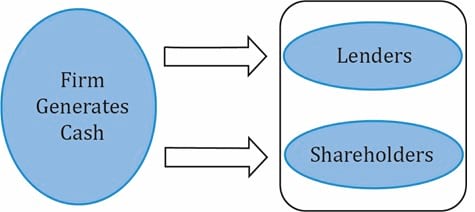
Free cash flow to firm (FCFF) is the cash flow available to all the suppliers of capital to a company after all operating expenses have been paid and necessary investments in working capital and fixed capital have been made. The suppliers of capital include both lenders (debt) and equity shareholders (equity). This is illustrated in the figure below:
The formula for computing FCFF is:
where:
FCFF = NI + NCC + Int (1- tax rate) – FCInv – WCInv
NI = Net Income
NCC = non-cash charges
Int = Interest expense
FCInv = Fixed capital investment/expenditures
WCInv = working capital expenditures
While FCFF indicates how much cash is available to all suppliers of capital, free cash flow to equity (FCFE) is the cash flow available to the company’s stockholders after all operating expenses and borrowing costs (principal and interest) have been paid and necessary investments in working capital and fixed capital have been made. The formula for computing FCFE is as follows:
FCFE = CFO – FCInv + Net Borrowing
There are several ratios useful for the analysis of the cash flow statement. These ratios generally fall into cash flow performance (profitability) ratios and cash flow coverage (solvency) ratios. The calculation and interpretation of these ratios are summarized in the tables below.
| Performance Ratios | Calculation | What It Measures |
| Cash flow to revenue | CFO ÷ Net revenue | Operating cash generated per dollar of revenue. |
| Cash return on assets | CFO ÷ Average total assets | Operating cash generated per dollar of asset investment. |
| Cash return on equity | CFO ÷ Average shareholders’ equity | Operating cash generated per dollar of owner investment. |
| Cash to income | CFO ÷ Operating income | Cash generating ability of operations. |
| Cash flow per share | (CFO – Preferred dividends) ÷ Number of common shares outstanding | Operating cash flow on a per-share basis. |
| Coverage Ratios | Calculation | What It Measures |
| Debt coverage | CFO ÷ Total debt | Financial risk and financial leverage. |
| Interest coverage | (CFO + Interest paid + Taxes paid) ÷ Interest paid | Ability to meet interest obligations. |
| Reinvestment | CFO ÷ Cash paid for long-term assets | Ability to acquire assets with operating cash flows. |
| Debt payment | CFO ÷ Cash paid for long-term debt repayment | Ability to pay debts with operating cash flows. |
| Dividend payment | CFO ÷ Dividends paid | Ability to pay dividends with operating cash flows. |
| Investing and financing | CFO ÷ Cash outflows for investing and financing activities | Ability to acquire assets, pay debts, and make distributions to owners. |


Ace the Exam with IFT Notes!

Ace the Exam with Active Learning!

Practice your way to success!
 Do IFT Mocks to make you exam-ready!

Accelerate your studies!


Sign up to get more!