fbpixel Applications of Financial Statement Analysis | IFT World
IFT Notes for Level I CFA® Program

LM12 Applications of Financial Statement Analysis

Part 1


1. Introduction & Evaluating Past Financial Performance

This reading brings us to the end of financial reporting and analysis. Think of this reading as a practical application of steps outlined for a financial analysis framework (define purpose, collect and process data, analyze and interpret, recommend and follow-up). Some of the questions we will address over the next few sections are:

  • What factors to consider when evaluating a company’s past financial performance?
  • How to approach forecasting a company’s future net income and cash flow?
  • How can a financial statement analysis be used to evaluate the credit quality of a fixed income statement?
  • How can it be used to identify potential equity investments?
  • What adjustments do analysts need to make so that the financial ratio comparison between companies is meaningful?

1.1 Application: Evaluating Past Financial Performance

Evaluating past performance helps analysts assess how the company performed and the reasons behind its performance (why it performed the way it did). When studying a company, some key analytical questions include the following:

  • How and why have corporate measures of profitability, efficiency, liquidity, and solvency changed over the period being analyzed?
  • How do the level and trend in a company’s profitability, efficiency, liquidity, and solvency compare with the corresponding results of other companies in the same industry? What factors explain any differences?
  • What aspects of performance are critical for a company to successfully compete in its industry? How did the company perform relative to those critical performance aspects?
  • What is the company’s business strategy? Do the financials reflect the strategy?

To evaluate how a company performed, an analyst can process data by creating common-size financial statements, calculating ratios, and analyzing industry-specific metrics. Some of the factors an analyst must be aware of when evaluating financial performance are discussed below:

Change in Company’s Strategy

The effect of a company’s strategy is reflected in its performance. Let us take the example of Apple Inc.

  • Apple was primarily a personal computer technology company until early 2000’s.
  • The company’s strategy changed substantially between 2007 and 2010 and as a result its product mix with the introduction of iPod, iPad and iPhone.
  • The company wanted to become a pioneer in the personal interactive electronics space by leveraging its unique ability to design and develop.
  • The change in strategy is evident in its financial performance. In 2005, iPod became Apple’s bestselling product. By 2009, iPhone became Apple’s most sold product. The share of computers in sales continued to decline.
  • When a company sells differentiated products, it can charge higher prices. Premium prices lead to higher gross margins. Impact on operating profit margins, however, is weaker relative to gross margins because a company has to spend on advertising and research to support differentiated products.

Differences in Accounting Standards

When comparing the ratios of different companies, analysts must be aware of the accounting standards, methods, and estimates used for reporting as they can have a significant impact on the financial statements. Let us consider the example below where the ROE of three companies reporting under different accounting standards are given. For comparison, they are then converted to US GAAP.

ROE of three companies for a year (in %)
Mexican GAAP Brazilian GAAP US GAAP
Mexican company 52.69 211.12
Brazilian company -7.89 29.34
U.S. company 12.69

While the Mexican company reported the highest ROE under Mexican and US GAAP, the Brazilian company turned profitable under US GAAP after posting a negative ROE. The table illustrates why it is important to make adjustments to a common standard such as US GAAP before comparing the financial ratios of companies.

This comparison only provides information about how a company performed. To understand why it performed better or worse, analysts gather information from the management commentary, MD&A, and industry sources such as consumer surveys. The results of a past performance analysis set the ground for making recommendations.

2. Application: Projecting Future Financial Performance as an Input to Market Based Valuation

To estimate the target price for a company’s stock, an analyst needs to forecast EPS. The inputs for estimating EPS are future sales and profit. The steps usually followed for projecting performance are illustrated below:

image22

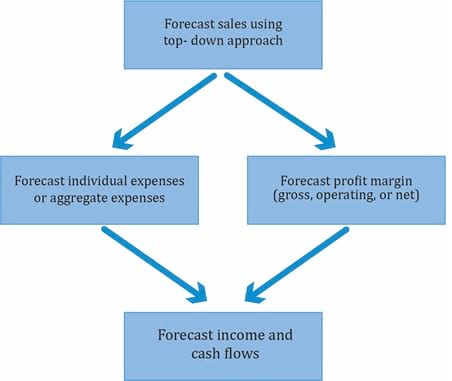
Notice that future income can be projected in two ways: by estimating expenses and by forecasting future profit margins. The individual steps used to forecast sales and profit margin are listed below:

Forecast Sales

Analysts often take a top-down approach to forecasting sales.

  • Forecast expected GDP growth rate.
  • Forecast expected industry sales based on historical relationship with GDP. For example, based on historical data, an analyst may conclude that a 3% increase in GDP corresponds to a 3% increase in industry sales.
  • Forecast expected change in company’s market share, i.e., whether a company is expected to gain, lose, or retain its market share over the forecasting period. Market share projections may be based on historical data or forward-looking analysis.
  • Forecast expected company sales by multiplying projected market share by projected total industry sales.

Forecast Expenses

  • Use historical margin for stable firms like Johnson & Johnson.
  • For less stable firms like Facebook, estimate each expense item.
  • Remove non-recurring items.
  • Estimate interest expense based on the level of debt; estimate tax expense based on the tax rate and the earnings before taxes.
  • Those special charges that are reported every year are not transitory and thus should be included in evaluating past and future margins.

Forecast Cash Flows

  • Estimate changes in working capital.
  • Estimate investment expenditures.
  • Estimate dividend payments.

Instructor’s Note: Section 3 ‘Projecting Multiple-Period Performance’ is not testable and hence not covered.

4. Application: Assessing Credit Risk

Another application of financial statement analysis is in assessing the credit risk of a borrower. Credit risk is the risk that the borrower will fail to make the obligated interest and principal payments. Credit analysis is the evaluation of credit risk. The purpose of credit analysis is to determine whether a company will be able to service its debt (interest and principal payments) on time. A credit analysis exercise is likely to include an evaluation of the following:

  • Profitability (net profit margin, operating margin, etc.)
  • Cash flows and the variability of cash flows. If the cash flow is highly volatile, then it becomes a concern.
  • Business risk (low revenues and high expenses).
  • Financial risk (high debt and low operating profit).

Let us take a look at how Moody’s assigns credit ratings for a company based on the following groups of qualitative factors:

  • Scale: Refers to a company’s sensitivity to adverse events that affect debt-paying ability. Larger size and scale indicate prior success, and the company’s ability to adapt to changing economic conditions.
  • Business profile: Refers to ‘a company’s competitive position, stability of revenues, product and geographic diversity, growth prospects, and the stability and volatility of cash flows.
  • Leverage and coverage: Refers to a ‘company’s “financial flexibility” and viability’.
  • Financial policy: Refers to a ‘company’s financial risk tolerance and its capital structure’.


Live Classes For August 2024 CFA Program Exam
This is default text for notification bar