
A sample is a subset of a population. We can study a sample to infer conclusions about the population itself. For example, if all the stocks trading in the US are considered a population, then indices such as the S&P 500 are samples. We can look at the performance of the S&P 500 and draw conclusions about how all stocks in the US are performing. This process is known as sampling and estimation.
There are various methods for obtaining information on a population through samples. The information we obtain usually concerns a parameter, a quantity used to describe a population. To estimate a parameter, we use sample statistics. A statistic is a quantity used to describe a sample.
There are two reasons why sampling is used:
There are two types of sampling methods:
All else equal, the probability sampling method is more accurate and reliable as compared to the non-probability sampling method.
In the subsequent sections, we will discuss the following sampling methods:
Simple random sampling is the process of selecting a sample from a larger population in such a way that each member of the population has the same probability of being included in the sample.
Sampling distribution
If we draw samples of the same size several times and calculate the sample statistic, the sample statistic will be different each time. The distribution of values of the sample statistic is called a sampling distribution.
For example, say you select 100 stocks from a universe of 10,000 stocks and calculate the average annual returns of these 100 stocks. Let’s say you get an average return of 15%. You repeat this process with a second sample of 100 stocks. This time, you get an average return of 14%. You keep repeating this process and each time you get a different average return. The distribution of these sample average returns is called a sampling distribution.
Sampling error
Sampling error is the difference between a sample statistic and the corresponding population parameter. The sampling error of the mean is given by:

For example, let’s say you want to estimate the average returns of 10,000 stocks. You draw a sample of 100 stocks and calculate the average return of these 100 stocks as 15%. However, the actual average of the 10,000 stocks was 12%. Then the sampling error = 15% – 12% = 3%.
Systematic sampling: In this technique, we select every kth member of the population until we have a sample of the desired size. Samples created using this technique should be approximately random.
Instructor’s Note: Researchers calculate the sampling interval ‘k’ by dividing the entire population size by the desired sample size.
In stratified random sampling, the population is divided into subgroups based on one or more distinguishing characteristics. Samples are then drawn from each subgroup, with sample size proportional to the size of the subgroup relative to the population. Finally, samples from each subgroup are pooled together to form a stratified random sample.
The advantage of stratified random sampling is that the sample will have the same distribution of key characteristics as the overall population. This can help reduce the sampling error. Stratified random sampling therefore produces more precise parameter estimates than simple random sampling
For example, you divide the universe of 10,000 stocks as per their market capitalization such that you have 5,000 large cap stocks, 3,000 mid cap stocks, and 2,000 small cap stocks. In stratified random sampling, to select a total sample of 100 stocks, you will randomly select 50 large cap stocks, 30 mid cap stocks, and 20 small cap stocks and pool all these samples together to form a stratified random sample.
Example
Paul wants to categorize publicly listed stocks for his research project. He first divides the stocks into 15 industries. Then from each industry, he categorizes companies into three groups: small, medium, large. Finally, he divides these into value versus growth stocks. How many cells or strata does the sampling plan entail?
Solution:
C is correct. This is an application of the multiplication rule of counting. The total number of cells is the product of 15, 3, and 2. Thus the answer is 90.
Cluster sampling is similar to stratified random sampling as it also requires the population to be divided into subpopulation groups, called clusters. Each cluster is essentially a mini-representation of the entire population. Then some random clusters are chosen as a whole for sampling.
Instructor’s Note: Clusters are generally based on natural groups separating the population. For example, you might be able to divide your data into natural groupings like city blocks, voting districts, or school districts.
The main difference between cluster sampling and stratified random sampling is that in cluster sampling, the whole cluster is selected; and not all clusters are included in the sample. In stratified random sampling, however, only a few members from each stratum are selected; but all strata are included in the sample.
The difference between simple random sampling, stratified random sampling, and cluster sampling is illustrated in the figure below:
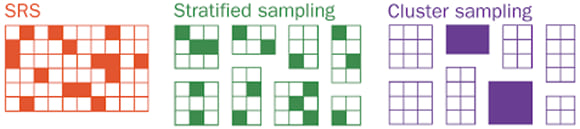
As compared to SRS and stratified sampling, cluster sampling is less accurate because the chosen sample may be less representative of the entire population. However, this method is the most time-efficient and cost-efficient amongst the three.
The two major types of non-probability sampling methods are:
Instructor’s Note: This section does not contain testable concepts. The core point is presented below.
In addition to selecting an appropriate sampling method, researchers also need to be careful when sampling from a population that is not under one single distribution. In such cases, the larger population should be divided into smaller parts, and samples should be drawn from the smaller parts separately.
The sample mean is a random variable with a probability distribution known as the statistic’s sampling distribution. To understand this concept, consider the following population: last year’s returns on every stock traded in the United States. We are interested in the mean return of all stocks but do not have time to calculate the population mean. Hence, we draw a sample of 50 stocks and compute the sample mean. We then draw another sample of 50 stocks and compute the sample mean. This exercise can be repeated several times giving us a distribution of sample means. This distribution is called the statistic’s sampling distribution. The central limit theorem, explained below, helps us understand the sampling distribution of the mean.
According to the central limit theorem, if we draw a sample from a population with a mean µ and a variance σ2, then the sampling distribution of the sample mean:
For example, suppose the average return of the universe of 10,000 stocks is 12% and its standard deviation is 10%. Through central limit theorem we can conclude that if we keep drawing samples of 100 stocks and plot their average returns, we will get a sampling distribution that will be normally distributed with mean = 12% and variance of 102/100 = 1%.
The standard deviation of the distribution of the sample means is known as the standard error of the sample mean.
When we know the population standard deviation, the standard error of the sample mean can be calculated as:

When we do not know the population standard deviation (σ) we can use the sample standard deviation (s) to estimate the standard error of the sample mean:

Example
The mean of a population is 12 and the standard deviation is 3. Given that the population comprises of 64 observations, what is the standard error of the sample mean?
Solution:
A is correct. Standard Error = σ/√n = 3/√64 = 0.375


Ace the Exam with IFT Notes!

Ace the Exam with Active Learning!
 Do IFT Mocks to make you exam-ready!

Accelerate your studies!

Practice your way to success!


Sign up to get more!