
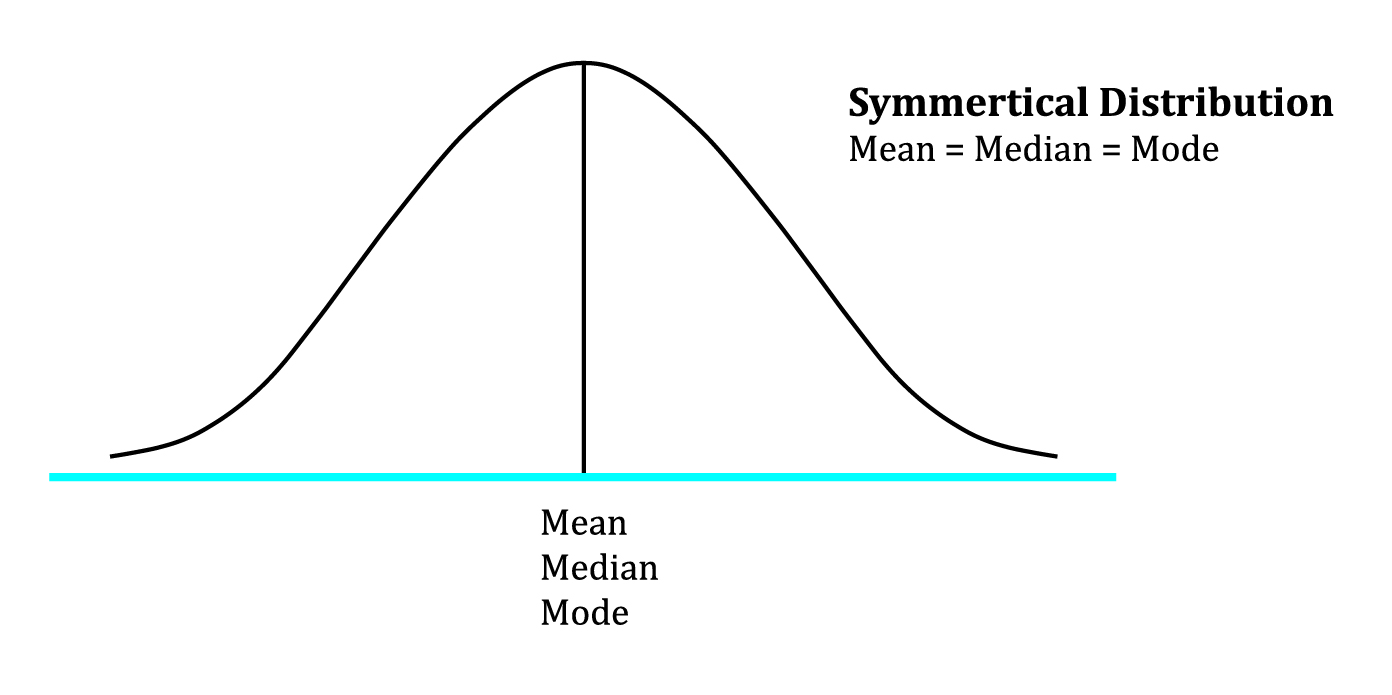
Symmetrical distribution
A distribution is said to be symmetrical when the distribution on either side of the mean is a mirror image of the other.
In a normal distribution, mean = median = mode.
If a distribution is non-symmetrical, it is said to be skewed. Skewness is a measure of the asymmetry of the probability distribution. Skewness can be negative or positive.
Positively skewed distribution
A positively skewed distribution has a long tail on the right side, which means that there will be frequent small losses and few large gains.
Here the mean > median > mode. The extreme values affect the mean the most which is pulled to the right. They affect the mode the least.
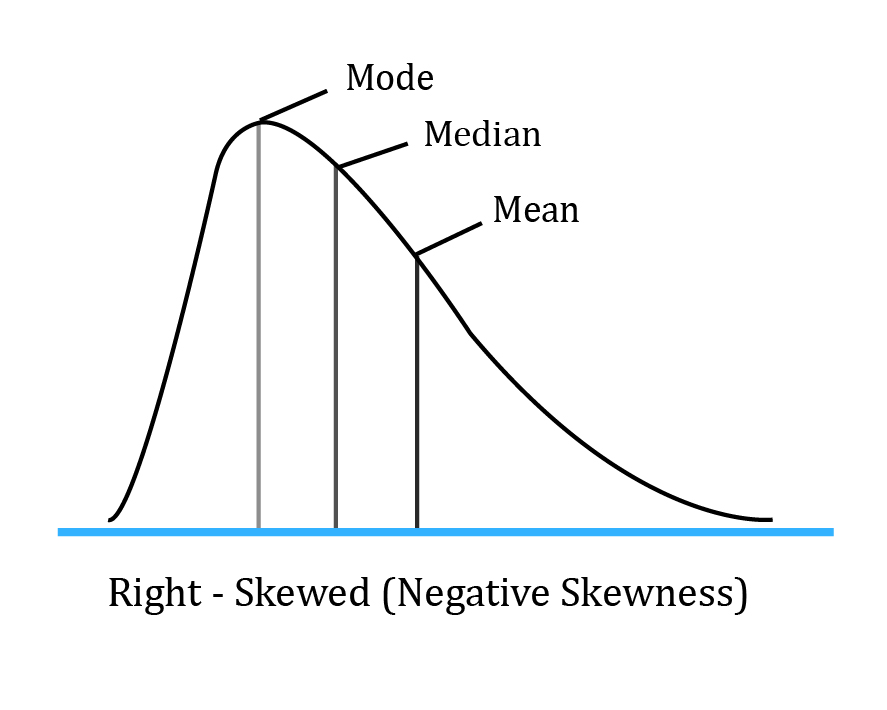
Negatively skewed distribution
A negatively skewed distribution has a long tail on the left side, which means that there will be frequent small gains and few large losses.
Here the mean < median< mode. The extreme values affect the mean the most which is pulled to the left. They affect the mode the least.

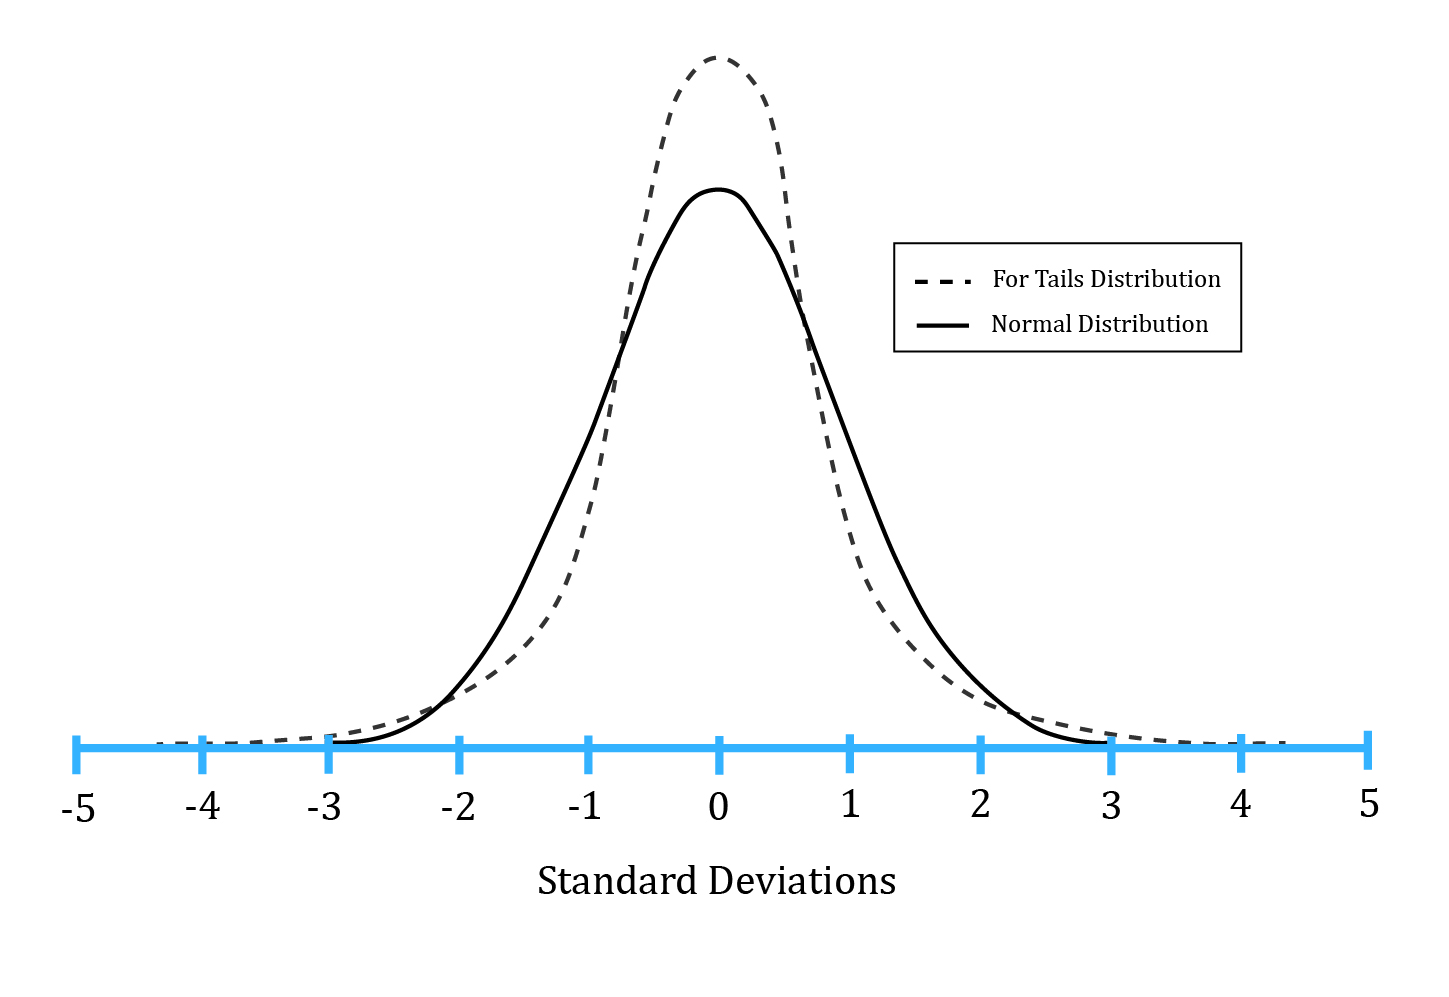
Kurtosis is a measure of the combined weight of the tails of a distribution relative to the rest of the distribution.
Excess kurtosis = kurtosis – 3. An excess kurtosis with an absolute value greater than one is considered significant.
The following figure shows a leptokurtic distribution. As compared to a normal distribution, a leptokurtic distribution is more likely to generate observations in the tail region. It is also more likely to generate observations near the mean. However, to have the total probabilities sum to 1, it will generate fewer observations in the remaining regions (i.e. regions between the central and the two tail regions)
The geometric mean is appropriate to measure past performance over multiple periods.
Example
The portfolio returns for the past two years were 100% in year 1 and -50% in year 2. What was the mean return?
Solution:
Past return = geometric mean = (2 x 0.5)0.5 – 1 = 0%
The arithmetic mean is appropriate for forecasting single period returns.
Example
Two possible returns for the next year are 100% and -50%. What is the expected return?
Solution:
Expected return = Arithmetic mean = (100 – 50)/2 = 25%


Ace the Exam with Active Learning!

Ace the Exam with IFT Notes!

Accelerate your studies!
 Do IFT Mocks to make you exam-ready!

Practice your way to success!


Sign up to get more!