
The previous few readings focused on microeconomics, which is the study of individual economic units such as individual households, firms, or markets. In this reading, we will start with the basics of macroeconomics, which is a study of aggregate behavior of households, firms and markets.
This reading covers:
Aggregate output of an economy: It is the value of all goods and services produced during a period.
Aggregate income of an economy: It is the value of all the payments earned by the suppliers of the factors used in the production of goods and services. Payments are classified into four categories:
Operating surplus of Company = Rent + interest + profit
Operating surplus represents the return on all capital used by the business.
Aggregate expenditure: The total amount spent on goods and services produced in an economy during a given period. Aggregate Expenditure = Aggregate Output = Aggregate Income.
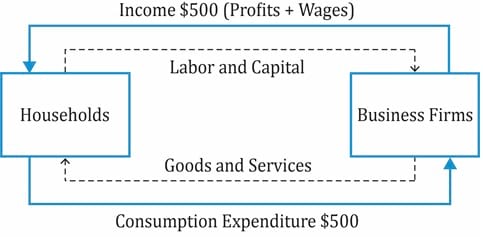
Let us take a simple economy, comprising households and business firms. Households provide labor and capital to the firms. Businesses, in turn, make payments to households to compensate them for labor. Households earn an income of $500 towards labor and profits earned on the capital invested. This income can also be seen as the households’ expenditure on firms. This shows the total output produced by the firms must equal aggregate income.
What is GDP?
There are two ways of defining GDP:
To ensure consistency across countries and across time, the following criteria are used:
Calculating Gross Domestic Product
GDP can be calculated using the income approach or the expenditure approach.
The income approach computes GDP as the total income earned by households, businesses, and the government in a given period.
The expenditure approach computes GDP as the total amount spent on goods and services. Two methods are used to calculate the total amount spent:
Let’s take a simple example discussed in the curriculum.
The data associated with the example is presented in the table below:
| Value of final products equals income created (in €) | ||
| Receipts at each stage | Value added | |
| Receipts of farmer from miller | 0.15 | 0.15 |
| Receipts of miller from baker | 0.46 | 0.31 ( = 0.46 – 0.15) |
| Receipts of baker from retailer | 0.78 | 0.32 ( = 0.78 – 0.46) |
| Receipts of retailer from final buyer | 1.00 | 0.22 ( = 1.00 – 0.78) |
| Total | 1.00 | 1.00 |
There are two ways to calculate the value of output:
Nominal and Real GDP
Nominal GDP measures the value of goods and services at their current prices.
Real GDP measures current-year output using prices from a base year. This eliminates the effect of inflation.
Example: Consider a country that only produces cotton. In 2010, 1 million tons were produced at Rs100 per ton. In 2012, 1 million tons were produced at Rs120 per ton. What is the nominal and real GDP in 2012? Assume that 2010 is the base year.
Solution:
Nominal GDP = 120 * 1 million = 120 million
Real GDP = 1 million * 100 = 100 million
Inference:
As you can see, the output has not gone up. The nominal GDP is higher by 20% because of the inflation effect. To assess the exact change in output, it is judicious to use real GDP as it eliminates the price effect. Real GDP reflects the actual quantity of output available for consumption and investment.
GDP Deflator: used to measure inflation across all sectors of an economy such as consumer, business, government, exports, and imports. It is reported as a price index number that can be used to convert nominal GDP into real GDP by removing the effects of changes in prices.

It can also be written as:

Going back to the cotton example, using this formula, the GDP deflator for 2010 =  . For 2012, GDP deflator for 2012 =
 . The GDP deflator indicates that the price has increased by 20% over the two years.
Example
Calculate the implicit GDP price deflator from 2009 to 2012 and the inflation rate for 2012 given the following data:
| 2009 | 2010 | 2011 | 2012 | |
| GDP at market prices | 100 | 110 | 118 | 125 |
| Real GDP | 90 | 92 | 94 | 95 |
| Implicit GDP price deflator |  |
 |
 |
 |
Solution:
| 2009 | 2010 | 2011 | 2012 | |
| Implicit GDP price deflator | |
|
|
|
Inflation rate for 2012 = 


Ace the Exam with IFT Notes!

Ace the Exam with Active Learning!

Practice your way to success!
 Do IFT Mocks to make you exam-ready!

Accelerate your studies!


Sign up to get more!