IFT Notes for Level I CFA® Program
LM04 Understanding Business Cycles
Part 4
10. Unemployment
Most governments try to limit unemployment and contain inflation because these conditions can lead to social and political unrest. The graph below shows the relationship between these variables and the business cycle:
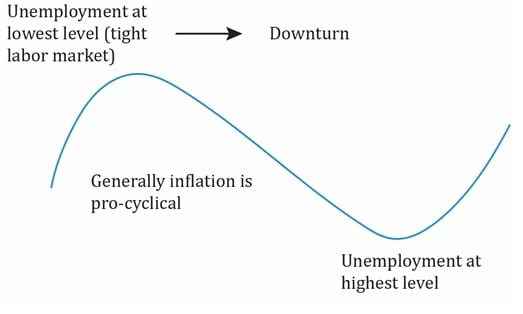
Interpretation of the graph:
- Unemployment is at its lowest at the peak of the business cycle. This is also indicative of a tight labor market. This situation may also trigger a downturn in the economy, because the bargaining power of labor increases. Workers demand high wages as inflation is at its peak now and they expect prices of goods to further go up. Labor costs account for a significant part of a firm’s costs. When wages are up, the SRAS shifts to the left, causing a decrease in real GDP.
- If central banks act to tame inflation, it may result in recession.
- Unemployment is at its highest level at the trough of the economic cycle. Unemployment numbers lag the cycle as we will see shortly, but they are closely related to the cycle.
- Inflation numbers move along with the business cycle. So, it is said to be pro-cyclical.
10.1 Unemployment
The table below lists some important terms related to unemployment:
| Terms related to unemployment |
| Employed |
Number of people with a job. Excludes informal workers such as illegal workers. |
| Working age |
Those between 16 and 64 years of age. |
| Labor force |
Includes unemployed and employed i.e. working age population who are either working or looking for work. Discouraged workers are not included here. |
| Unemployed |
People who are actively seeking employment, but currently without a job. To be considered unemployed, one must have been looking for work in the past 4 weeks. |
| Long-term unemployed |
People who have not been working for a long-time (3-4 months). |
| Frictionally unemployed |
People who are between jobs. They are not working at the time of filling the survey. But, they are not 100 percent unemployed. They have another job waiting and are yet to start. |
| Structurally unemployed |
Unemployment that arises because the demand for certain skills has reduced while employers are looking for a different set of skills. Ex: need for typists decreased because of computers/public telephone operators decreased in developing countries because of mobile phones. It can also be due to changes in business, technology, etc. |
| Activity (participation) ratio |
|
| Underemployed |
A person who has a job that pays significantly less for the qualifications they possess. Ex: a person out of work with a CFA charter working in a grocery store. |
| Discouraged worker |
A person who has stopped looking for a job probably because of a weak economy. They are not included in the unemployment rate. If they stop looking for work, then unemployment rate may decrease in a recession. |
| Voluntarily unemployed |
Person voluntarily outside the labor force. Ex: early retirees, a 22-year old who is pursuing a Master’s degree and hence not looking for work. |
| Unemployment rate |
|
Unemployment Rate
Unemployment rate = 
- Most quoted measure of employment.
- Measured differently in different countries, which makes international comparisons difficult. Some countries may include even people of working age who are not willing to work, or underemployed.
- Unemployment rate is inaccurate in predicting the direction of an economy. It lags the economic cycle because it is the economic environment that forces people to look actively for jobs or drop out of it. The following two reasons elaborate on why it is an inaccurate indicator:
- Businesses are reluctant to lay off people as it is more expensive to hire and train new workers.
- In difficult economic times, discouraged workers stop looking for jobs (hence not counted as unemployed). So the unemployed number becomes low. But, when the economy recovers, these people start looking for jobs again pushing the unemployed number up undermining recovery.
Overall payroll employment and productivity indicators:
- To get a sense of the employment cycle and address the issue of discouraged workers, analysts often look at payroll growth. Most companies publish their payroll data. If payroll numbers are increasing, then unemployment is decreasing.
- Two other measures used to understand the employment situation: overtime hours and the number of temporary workers. During a recovery, the first step taken by firms is to increase overtime hours instead of hiring new workers. Then, they increase the number of temporary workers. The opposite happens at the peak of a business cycle. Instead of laying off workers immediately, firms first reduce overtime hours, and then reduce temporary workers.
- Productivity is ). A drop in productivity (idling workers) precedes decrease in full-time payrolls. There is a decrease in full-time payrolls once the economy moves fully into recession.
- Conversely, an increase in productivity precedes an increase in full-time payrolls.
11. Inflation
Key points related to inflation are as follows:
- Generally, inflation is pro-cyclical (it goes up and down with the business cycle).
- Inflation is the sustained rise in the overall level of prices in an economy. Assume that the price of a good increases from 100 to 105, and stays constant. Is this inflation? No. It must be a steady rise in the price level. In simple terms, inflation means the same amount of money can purchase a lesser amount of goods and services in the future.
- Inflation rate is the percentage change in a price index.
- Inflation rates allow us to infer the state of the economy. High inflation is the sign of an overheated economy.
- Unexpected change in inflation may trigger a change in monetary policy that can impact asset prices.
- High inflation, fast economic growth, and low unemployment indicate the economy is overheating. This may trigger some policy movements to tame inflation. Equilibrium GDP is above potential GDP.
- High inflation, high unemployment, and slow economic growth results in a situation called stagflation (stagnation + inflation).
11.1 Deflation, Hyperinflation, and Disinflation
- Deflation: A sustained decrease in aggregate price level. For example, price level comes down from 100 to 99 and then 98 and so on.
- Hyperinflation: An extremely fast increase in aggregate price level. Over a three-year time period if the price level doubles, then it is called hyperinflation.
- Occurs when government spending is greater than real tax revenue and there is unlimited money supply.
- Occurs usually after a war when the supply of goods and services is limited and there is too much money supply.
- Disinflation: A decline in the inflation rate, or a decelerating inflation. Prices are still going up over time, but at a slower rate than earlier. For example, two years ago, the inflation rate was 15%, last year it was 12%, and this year it is 9%.
What’s the difference between deflation and disinflation?
- With deflation, the price levels are going down, whereas with disinflation price levels are going up (positive inflation) but not at the same pace as before.
- The preferred inflation is 2% for developed economies. Otherwise, there is a risk of slipping into deflation. Value of money increases in deflation. Falling prices → lower revenues for the company → real debt borrowed by companies increases → cut in spending and investment → economy declines further. So, deflation is not good as was seen during the Great Depression.
11.2 Measuring Inflation: The Construction of Price Indexes
- Inflation rate is measured as the percentage change of a price index.
- A price index represents the average prices of a basket of goods and services. It determines the price change in one period relative to another.
- Base year/ period is the period with which prices are being compared to for the current period.
- Laspeyres index is the most common type of index; it is created by holding the consumption basket constant. For instance, the consumption basket last year could have been 5 loaves of bread and 10 liters of milk. If it changes this year to 6 loaves of bread and 12 liters of milk, then when calculating the index we take the initial quantities of the consumption basket and not the recent ones.
- Laspeyres index is a base-weighted index because the price increases are weighted using the quantities in the base period. This index number can then be used to calculate the inflation rate.
IL = 
where,
P1 = price in current year
P0 = price in base year
Q = quantity in base year
- Many countries use the Laspeyres index where the consumption basket is updated once every 5 years.
- This strategy introduces a few biases (all the biases cause the index to be overstated):
- Substitution bias: As price of a good increases, people substitute the good with a cheaper good.
- Assume you have a consumption basket comprising 5 units of fruits and 5 units of vegetables. If fruits become expensive, then people will change their consumption basket to 2 units of fruits and 8 units of vegetables. But the index computes prices based on a fixed consumption basket of 5 units of fruits and 5 units of vegetables. Index weighted on these quantities or an inflation rate based on this price index will be biased upward or overstated.
- Quality bias: Quality of goods and services improves over time. Let us take the example of cars. Even though cars have become expensive, the improvement in quality is more than the price, which is not reflected in the index calculation.
- New product bias: New products entering the market are not included in the consumption basket as the basket is fixed.
- Paasche index allows for the composition of the basket to change. It uses the consumption in the current period. It measures the change in the price of consumption basket weighted by using the quantities in the current period.
- Limitation of Paasche Index: It is difficult to make comparisons on a periodic basis as different weights are used every time.
Ip = 
where,
P1 = price in current year
P0 = price in base year
Q1 = quantity in current year
- Fischer index uses the geometric mean of the Laspeyres index and Passche index.
IF = 
Example
| Date |
January 2012 |
February 2012 |
| Goods |
Quantity |
Price |
Quantity |
Price |
| Sugar |
7 Kg |
90 / Kg |
9 kg |
110 / kg |
| Milk |
10 liters |
100 / liter |
12 liters |
120 / liters |
Assume the base period is January 2012. The price level for the base period is set to 100. Calculate the February price index as a:
- Laspeyres index
- Paasche index
- Fischer index
Solution:
- Laspeyres index in February 2012 =
 = 120.8
- Inflation rate =
 = 20.8%.
- Paasche Index in February 2012 =
 = 120.89.
- Fischer Index =
 = 121 .
11.3 Price Indexes and Their Usage
- Most countries use their own CPI to track inflation in the domestic economy.
- Weights of different categories vary across countries because the constituents of the consumption basket differ from one country to another (Exhibit 21 in the curriculum lists consumption basket of different CPI). For instance, the weight for food and beverage in CPI for China and India are 30% and 47.1% respectively. But it is much lesser for the developed countries.
- Scope of each index is different.
CPI-U: This CPI for the United States covers only the urban consumers using a household survey.
PCE: Personal consumption expenditure covers all personal consumption in the United States using business surveys.
PPI: Producer price index measures the average change in selling prices experienced by domestic producers in the country. If PPI goes up, then CPI also goes up as the inputs for firms increases. PPI is also called the wholesale price index (WPI) in some countries.
- Many economic activities are indexed to a certain price index.
Treasury Inflation Protected Securities (TIPS) adjust the bond’s par value based on CPI-U.
- Central banks use the CPI to monitor inflation.
Some important points based on examples from the curriculum:
- Headline inflation is based on the price index of all goods and services in an economy. Headline inflation reflects the actual cost of living.
- Core inflation is based on the price index of all goods and services in an economy except food and energy. In the short-term, prices of food and energy fluctuate a lot, so policy makers focus on core inflation. But, their long-term goal is to control headline inflation.
- Relative price is the price of a specific good or service in comparison with those of other goods and services.
- A sub-index is a price index for a specific category of goods and services. For example, a sub-index for food or energy.
11.4 Explaining Inflation
In this section, we look at the causes of inflation. Inflation can result from either an increase in aggregate demand or a decrease in aggregate supply.
Cost-push inflation: Inflation that results from a decrease in aggregate supply; it is caused by an increase in the real price of an important factor of production: wages or any raw material such as energy. Also known as wage-push inflation.
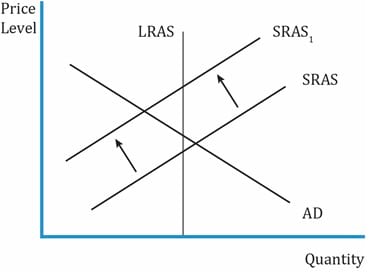
Interpretation of the graph:
- If there is an increase in the price of an input or wages, the SRAS curve will shift to the left.
- Real GDP decreases and the price level increases.
- This increase in cost creates a one-time rise in the price level.
The signs that analysts look for include:
- Commodity prices because commodities are a key input to production.
- Unemployment rate: The lower the rate of unemployment, the greater the likelihood that shortages will drive up wages. The higher the rate of unemployment, the lesser the likelihood of labor shortage. But, it does not represent the economy’s full labor potential and participation rate is a better indicator.
- The two metrics that analysts look for include:
- Non-accelerating inflation rate of unemployment (NAIRU): This is the level of unemployment where inflation does not rise or fall. If the unemployment rate falls below NAIRU, then there will be inflationary pressures.
- Natural rate of unemployment (NARU): If the unemployment rate falls below NAIRU, then there will be upward pressures on wages.
- Both these measures vary from one economy to another, and over time in a single economy.
- These measures have limitations. One of them is that the appropriate level below which inflationary wage pressures emerge is not known. Another limitation is that these metrics do not consider bottlenecks in specific segments of the labor market. For example, if the demand for skilled analytics engineers is high but the supply is low, then the wages for these workers will increase. But it may not be represented well in the overall metrics.
- NAIRU and NARU change over time with changes in technology and economic structure.
- NAIRU of an economy can be high if a large number of workers in the labor force do not have the skills that employers need.
- Productivity and unit labor cost: Looking at wage increase independently is not sufficient to determine its impact on price levels. Analysts must also consider productivity as the unit labor cost is directly linked to productivity. As productivity goes up, unit labor cost comes down.
- ULC is the average cost of labor per unit of output. The greater each worker’s output per hour, the lower the price businesses need to charge for each unit of output. Even if wages go up, since productivity is high, higher wages are less likely to put an upward pressure on wages.
Demand-pull inflation: Inflation that results from an increase in aggregate demand. Increase in aggregate demand increases the price level and temporarily increases economic output above its potential or full-employment level. It reflects the state of economic activity relative to potential.
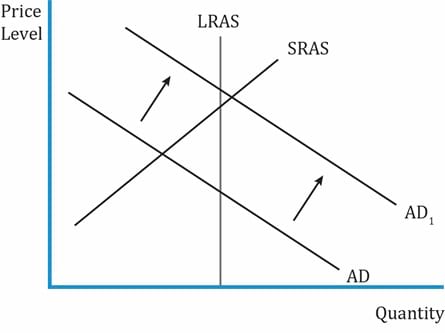
Interpretation of the graph:
- Initially, assume real GDP was below the potential GDP. If actual GDP is close to potential, then it leads to shortages and bottlenecks, and prices rise.
- An increase in aggregate demand shifts the AD curve to the right.
- Real GDP increases, price level increases. Real GDP is above potential GDP. There is an inflationary gap.
- This increase in the price level is called demand-pull inflation.
- Recall what we saw in the previous reading. The wages rise in response to price rise and pushes the SRAS left. Real GDP is back on the LRAS curve equal to potential GDP, but price has increased even further.
- If the AD continues to increase, then the price increases too.
- An increase in aggregate demand may be due to any of the following:
- Increase in money supply.
- Increase in government spending.
- Increase in exports.
- Monetarist perspective: Inflation is a monetary phenomenon, and they believe the money supply has a big role to play in determining inflation. If monetary authorities increase the money supply at a rate higher than the rate of potential GDP, and the money supply is more than the amount of goods and services available, then the prices tend to rise.
- Analysts compare money growth with the growth of the nominal economy to determine if there is demand-pull inflation.
Inflation Expectations
- Inflation expectations can be self-sustaining i.e. they persist even after the cause that triggered the price rise has disappeared.
- Some analysts gauge inflation expectations based on past trends.
Share on :


 Do IFT Mocks to make you exam-ready!


