
Absolute advantage: The ability of a country to produce a good at a lower cost or use fewer resources is called absolute advantage. Suppose there are only two countries, India and the United Kingdom. India exports clothes to the United Kingdom and the latter exports machinery. The output per worker per day is given in the table.
| Machinery | Cloth | |
| UK | 4 | 8 |
| India | 2 | 16 |
Looking at the table, the UK produces 4 machines per worker per day as compared to India, which produces 2. So clearly, the UK has an absolute advantage over India for producing machinery. Whereas, India has an absolute advantage in the production of clothes.
Comparative advantage: The ability to produce a good at a lower opportunity cost compared to another country is called comparative advantage. For example, country A has a comparative advantage over country B (trading partner) in producing machinery if country A can produce machinery at a lower opportunity cost. It is best illustrated with the help of an example. Consider the UK and India again. Looking at the table above, we can calculate the opportunity costs.
India:


The UK:


Hence, we can conclude that the UK has a comparative advantage in the production of machinery as it has a lower opportunity cost as compared to India. Whereas, India has a comparative advantage in the production of clothes because of the lower opportunity cost as compared to the UK.
Gains from trade
The table below collates exhibits 8 and 9 from the curriculum. It illustrates the effect on production and consumption under autarkic (no-trade) and post trade conditions.
| Autarkic production | Autarkic consumption | Post-trade production | Post-trade consumption | Change in consumption | |
| UK machine | 200 | 200 | 400 | 240 | +40 |
| UK cloth | 400 | 400 | 0 | 640 | +240 |
| India machine | 100 | 100 | 0 | 160 | +60 |
| India cloth | 800 | 800 | 1600 | 960 | +160 |
| World machine | 300 | 300 | 400 | 400 | +100 |
| World cloth | 1200 | 1200 | 1600 | 1600 | +400 |
Interpretation of the table:
Autarky: Production = Consumption
Open economy: The UK and India trade with each other
A country’s gains from trade are more if the terms of trade are closer to the partner’s autarkic prices than to its own autarkic prices. Terms of trade = price of exports/price of imports. In this example, India exports clothes to UK. Assume one yard of cloth in India is INR 5 while it is ₤5 in the UK, which is much higher. If India exports at a price much higher than the domestic price and closer to the UK price, then its gains from trade are more.
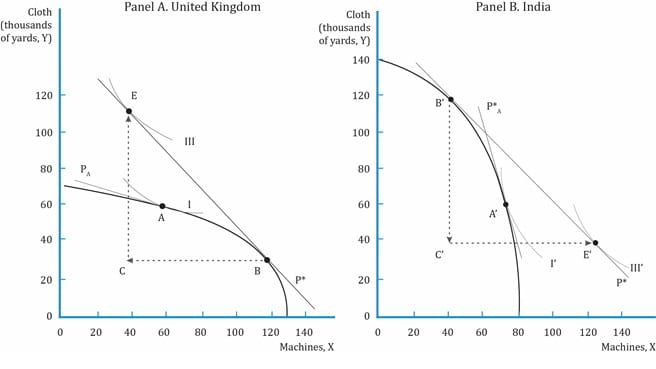
Production possibility frontier (PPF) is a graph that shows the maximum output possible of one good (cloth) for various outputs of another good (machines). PPF (the dark line) is plotted in the graphs below to show gains of trade with increasing costs for UK and India. Take the PPF for UK, for instance. As we move along the dark line from left to right, the production of cloth goes down and that of the machines goes up. Similarly, India gains more by producing cloth than machines. Under autarkic conditions, the consumption for both the countries must be on the PPF.
If the countries trade with each other, then the consumption is outside PPF as shown at points E, and the utility is more.
PA is the autarkic price line.
Different countries specialize in different goods while importing other goods. For example, China specializes in apparel, South Korea and Taiwan in electronics, the United States exports aircrafts but imports clothing etc.
| Ricardian and Heckscher-Ohlin Models | |
| Ricardian model | Heckscher-Ohlin (HO) |
| Adam Smith: A country may gain from trade if it has an absolute advantage. | Also known as factor-proportions theory. |
| Ricardo: A country may gain from trade if it has a comparative advantage, even if it does not have an absolute advantage. | Goods are produced with varying combinations of labor and capital. |
| The model assumes that labor is the only variable factor of production required to produce goods and services. | Unlike the Ricardian model, the HO model assumes a second factor of production: capital. So, there are two factors: labor and capital required to produce goods. |
| Labor productivity varies among countries due to differences in technology, which is the key source of comparative advantage. | Differences in the relative endowment of these factors are the sources of comparative advantage. The model assumes that technology in each industry is the same among countries, but it varies between industries. |
| Though differences in technology may be the key driver for comparative advantage, this gap may close with time.
For example: shift in IT from developed countries to India over the past two decades. |
The HO models uses a capital/labor ratio. If this ratio for a country A is greater than country B, then A is capital abundant while B is labor abundant. Similarly, good Y is capital intensive over good Z if the capital/labor ratio used in producing Y is greater than Z. Z in this case is labor intensive.
For example: steel is a capital-intensive industry; clothing is a labor intensive industry. The U.S. is a capital abundant country while India is a labor abundant country. |
| Allows for income redistribution through trade. Income level for labor working in an abundant industry goes up, but has a negative impact on the scarce factor. The demand for an input is called derived demand. | |
Example
Solution 1: Labor productivity.
Solution 2: Gains from trade are higher if the terms of trade are similar or closer to the autarkic prices of the trading partner.
Solution 3: Abundant factor.


Ace the Exam with Active Learning!

Ace the Exam with IFT Notes!
 Do IFT Mocks to make you exam-ready!

Practice your way to success!

Accelerate your studies!


Sign up to get more!