
The following figure show the UK government bond yield rates for July 2007, December 2010, and December 2011.
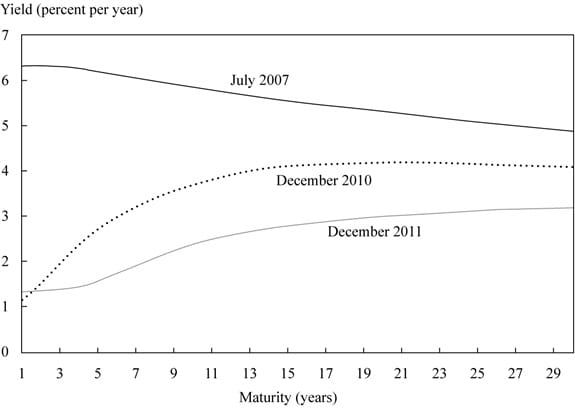
From the yield curve, it is evident that the UK short-term interest rates were higher in 2007 than the long-term interest rates. There was a significant change (decline) in interest rates between July 2007 and December 2010.
Yield curves have three characteristics:
Most of the yield curve movement can be explained by changes in level followed by slope followed by curvature.
The shape of the yield curve is determined by:
The term spread and the business cycle
A yield curve is downward sloping when investors expect inflation and future interest rates to decline. An inverted yield curve is a sign of recession.
When the economy is in a recession and interest rates are low, the yield curve will be upward sloping. A booming economy has high inflation and future short-term interest rates.


Sign up to get more!